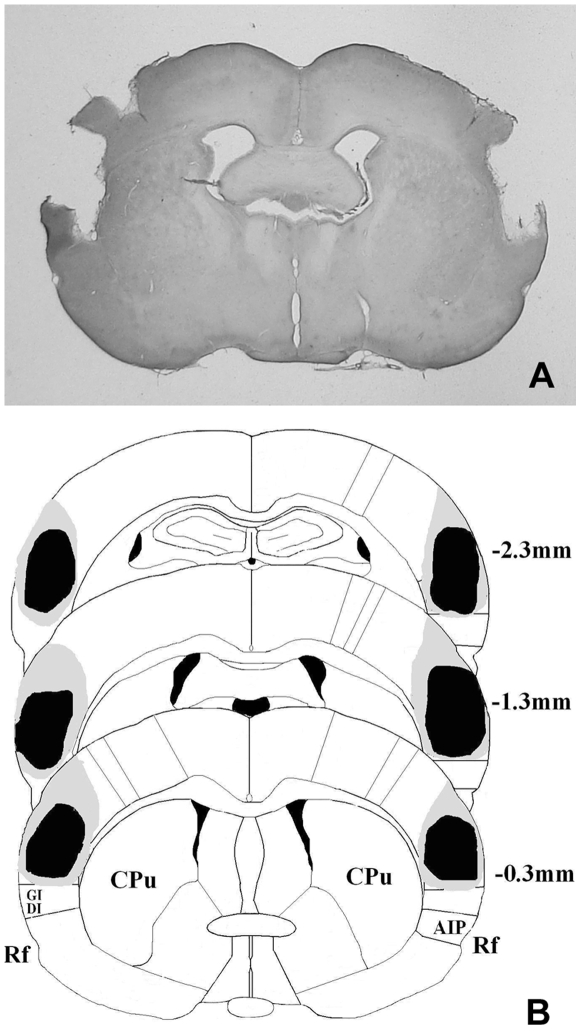
Figure 1. Histological localization of lesion sites.
(a) A representative photomicrograph of H.E stained coronal sections shows a typical electrolytic lesion of S2 and adjacent S1. (b) A schematic representation of the anatomical location of damaged regions by an electrolytic lesion on the coronal section adapted from the atlas of Paxinos and Watson. The black area and grey area mark the smallest and the largest lesion respectively. Numbers indicate anterior-posterior (AP) distances (in mm) from bregma. CPu, caudate putamen; AIP, agranular insular cortex, posterior; DI, dysgranular insular cortex; GI, granular insular cortex; Rf, rhinal fissure.

