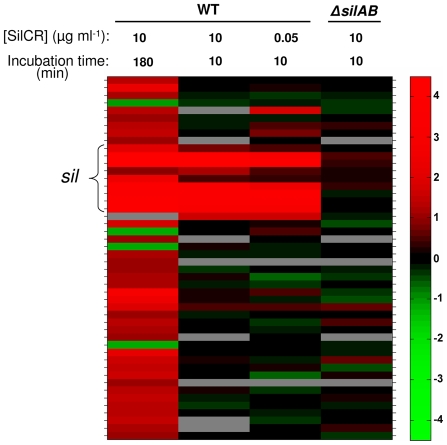
Figure 5. Global transcriptional analysis of JS95 in the presence of SilCR.
To identify genes whose transcription is affected by SilCR, we exposed strain JS95 and its ΔsilAB mutant to the conditions specified, and performed transcriptome analyses using a “universal” GAS microarray, as detailed in “Materials and Methods”. The results represent gene loci whose expression ratio changed by 2-fold or more with a p-value<0.05, at least in one of the experiments, visualized using the MatLab software. The genes are ordered vertically, based on their position in the genome (NC_008024) of M4-type strain MGAS10750 containing sil. The 9 genes of sil locus are indicated by a bracket. Grey bars represent cases when the replicate probes were highly inconsistent. For numerical values of the presented data and gene names see Table S5. The data is also available in NCBI Gene Expression Omnibus (GEO) (accession no GSE16961).

