
FIGURE 1.
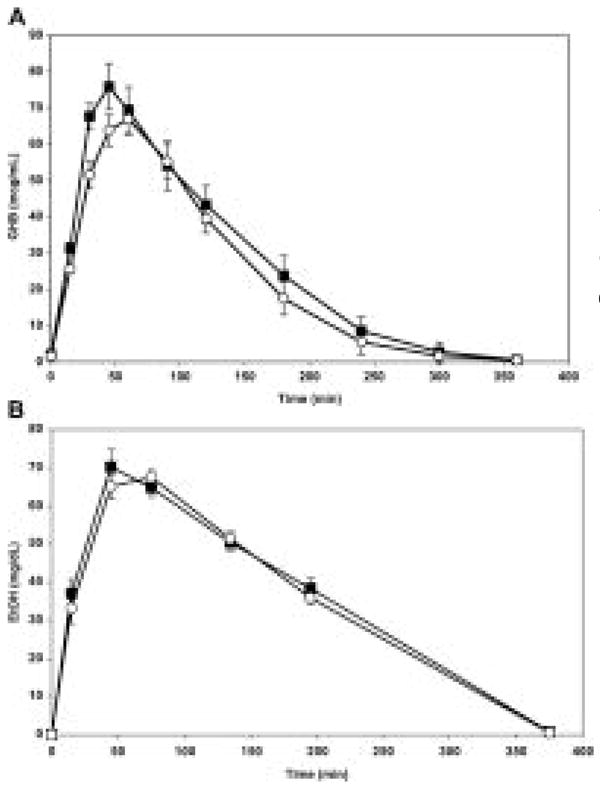
Mean plasma concentrations over time for GHB (A) and ethanol (B) after oral doses of the drugs were administered alone (open circles) and in combination (solid squares) (n = 16). Note that ethanol was dosed 15 minutes before GHB.
Official websites use .gov
A
.gov website belongs to an official
government organization in the United States.
Secure .gov websites use HTTPS
A lock (
) or https:// means you've safely
connected to the .gov website. Share sensitive
information only on official, secure websites.
Mean plasma concentrations over time for GHB (A) and ethanol (B) after oral doses of the drugs were administered alone (open circles) and in combination (solid squares) (n = 16). Note that ethanol was dosed 15 minutes before GHB.