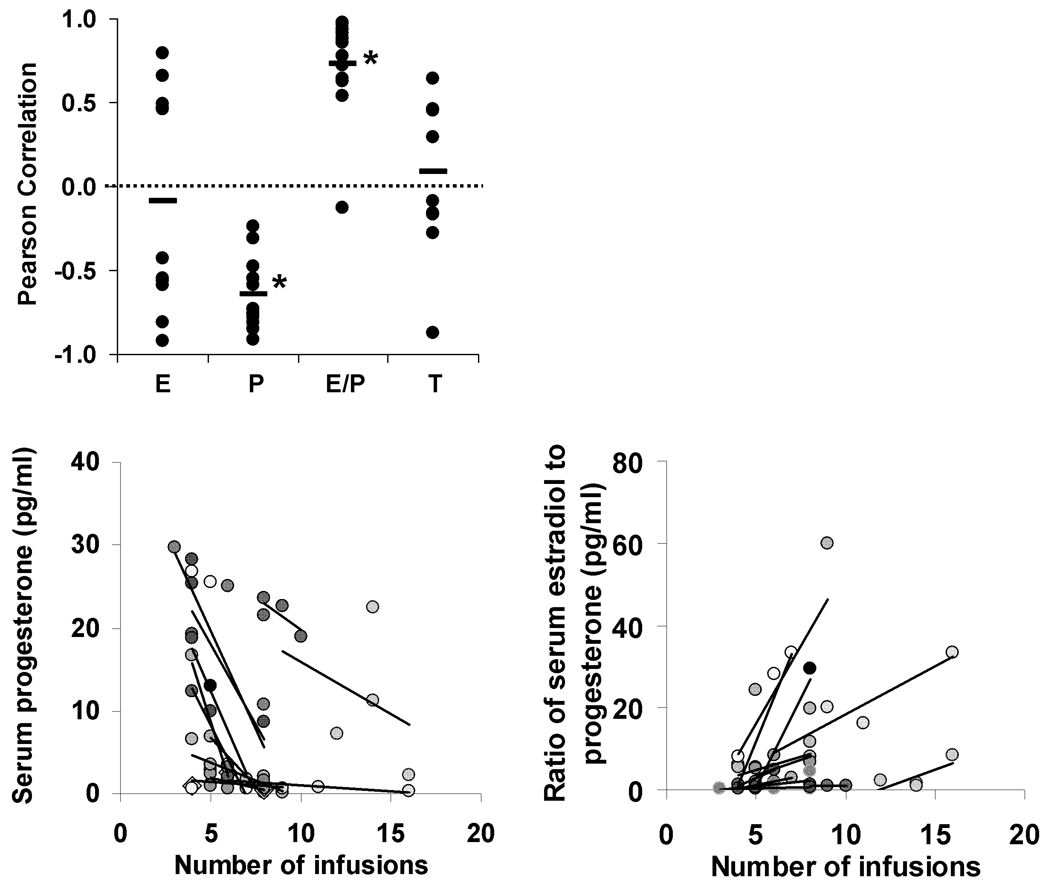
Figure 4.
(Top Panel) Data are plotted for each of the 12 females and 9 males for the relationship between serum hormones levels and the number of infusions obtained under the progressive-ratio schedule (E = estradiol; P = progesterone; T = testosterone). An asterisk indicates a significant difference from 0 (P<0.05). (Bottom Panels) Data are plotted for each of the 12 female rats for the relationship between serum concentration of progesterone (Left) and the ratio of estradiol to progesterone (Right) and the number of infusions obtained under the progressive-ratio schedule. Regression lines are also shown for each rat.

