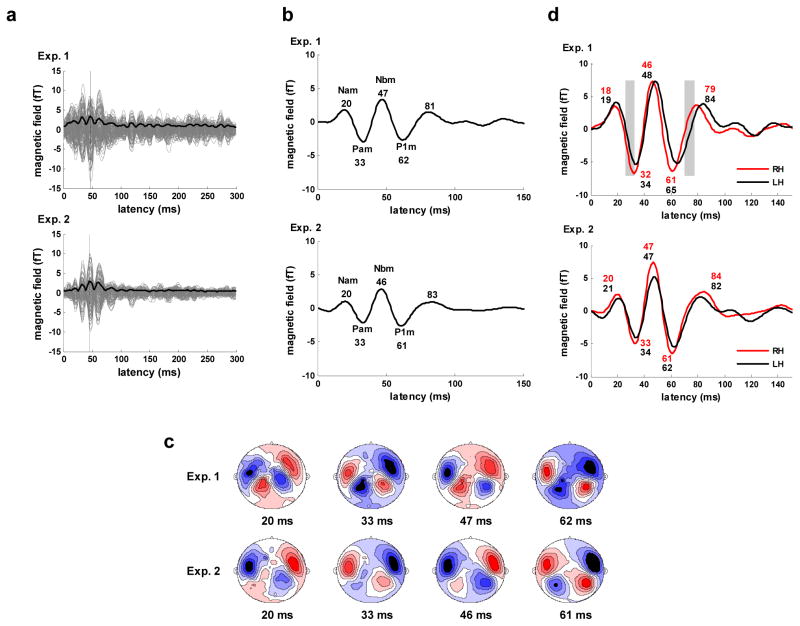
Figure 3.
Gamma band (22–58 Hz) response. a) Evoked response for Experiment 1 (upper) and 2 (lower). Response for all 157 channels (gray), whole-head RMS waveform averaged across all 157 channels (solid black), N1m peak in RMS waveform (vertical black). b) Whole-head evoked response waveforms (average across all 157 channels). Major components are labeled and latencies of component peaks (ms) are shown below labels. c) Contour maps of the evoked magnetic field at the major component peak latency times for Experiment 1 (upper) and 2 (lower). Sources shown in red, sinks in blue. d) Evoked response waveforms for the right (RH) and left (LH) hemispheres obtained by averaging over each hemisphere’s channels within the select 28 channel set. Major components are labeled and latencies of component peaks (ms) for the right (upper value, red) and left (lower value, blue) hemispheres are shown below labels. Areas of significant difference in response amplitude are indicated by gray blocks.

