
Figure 11.
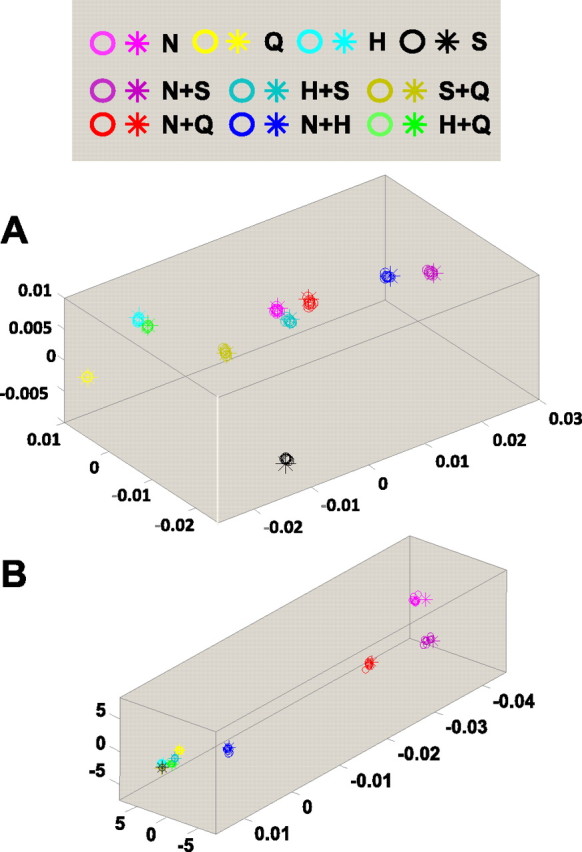
Results of an MDS analysis including 10 exchange-resampled spike trains (cluster centroids marked by circles) and the original data (cluster centroids marked by asterisks) for the cells shown in Figures 3–5 (A) and Figures 6 and 7 (B). The near-perfect alignment indicates that the rate envelopes produced by tastants determine the geometry of the response space.