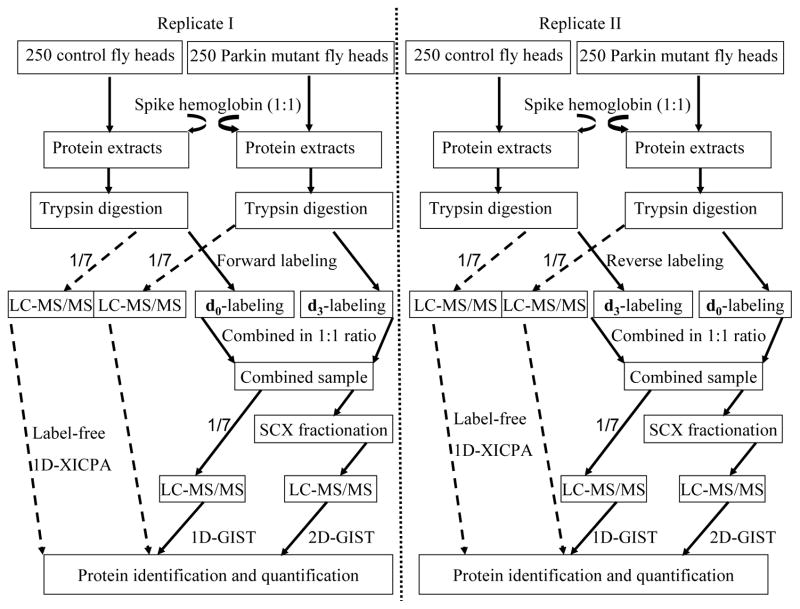
Figure 1.
Experimental design for quantitative proteomic analysis. Standard protein hemoglobin was spiked into equal amounts of control and pakin null mutants at a 1:1 ratio. Three approaches including a 1D-XICPA, a 1D-GIST, and a 2D-GIST were employed for the analyses of each biological dataset. For measurements with isotope labeling, two independent experiments were carried out by isotopically labeling biological replicate samples in forward and reverse directions.

