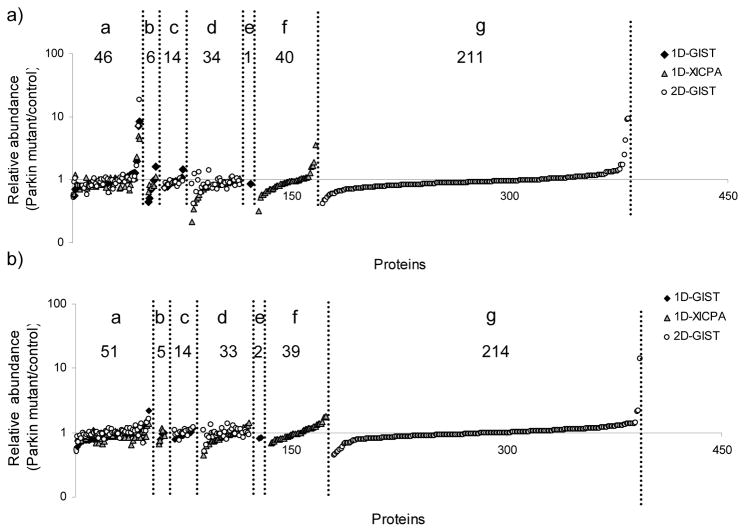
Figure 4.
Quantification profiles of proteins with a minimum of two peptide identifications from the combination of 1D-GIST, 1D-XICPA, and 2D-GIST measurements on a logarithm scale. a) protein quantification profile obtained from the analysis of the first biological replicate; b) protein quantification profile obtained from the analysis of the second biological replicate. Proteins were classified into seven groups: Group a, proteins quantified from all three approaches; group b, proteins that uniquely overlap between the 1D-GIST and 1D-XICPA approaches; group c, proteins that uniquely overlap between the 1D-GIST and 2D-GIST approaches; group d, proteins that uniquely overlap between the 1D-XICPA and 2D-GIST measurements; group e, proteins quantified only in the 1D-GIST experiment; group f, proteins quantified only in the 1D-XICPA experiment; and group g, proteins quantified only in the 2D-GIST experiment. Along the x axis are proteins identified in each group (see above) that were sorted in an ascent order of relative protein abundance (parkin mutant/control).

