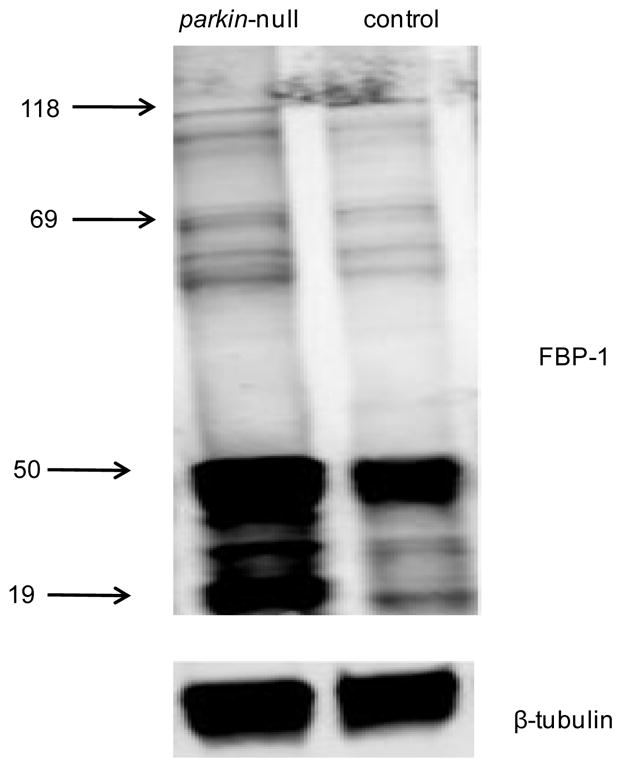
Figure 5.

Western blot analysis of FBP-1 using anti-FBP-1 polyclonal antibodies (top) with beta-tubulin (bottom) as the loading control. Many bands corresponding to the FBP-1 protein (118 kDa) and several FBP-1 fragments were detected. The fragments at 50 kDa and 19 kDa are the two most abundant species.
