
FIG. 3.—
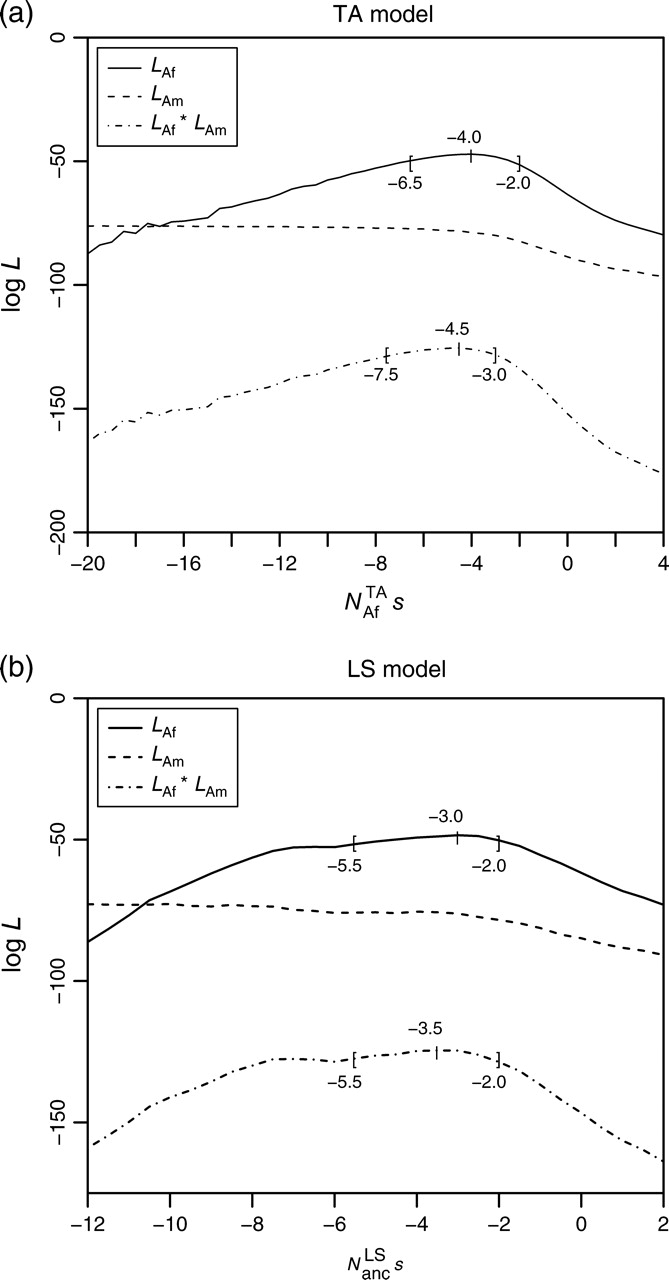
Likelihood curves for Ns based on BS element frequency data for North American, African, and combined Drosophila melanogaster subpopulations. On each curve, the ML estimate Ns* is indicated, as are the 2.5% and 97.5% confidence intervals. For North American data, no clear peaks in the likelihood curves can be observed and therefore no meaningful values Ns* and confidence intervals could be derived.