Abstract
NK cell-mediated resistance to viruses is subject to genetic control in humans and mice. Here we used classical and quantitative genetic strategies to examine NK-mediated murine cytomegalovirus (MCMV) control in genealogically related New Zealand white (NZW) and black (NZB) mice. NZW mice display NK cell-dependent MCMV resistance while NZB NK cells fail to limit viral replication after infection. Unlike Ly49H+ NK resistance in C57BL/6 mice, NZW NK-mediated MCMV control was Ly49H-independent. Instead, MCMV resistance in NZW (Cmv2) involves multiple genetic factors. To establish the genetic basis of Cmv2 resistance, we further characterized a major chromosome X-linked resistance locus (DXMit216) responsible for innate MCMV control in NZW × NZB crosses. We found that the DXMit216 locus affects early MCMV control in New Zealand F2 crosses and demonstrate that the NZB-derived DXMit216 allele enhances viral resistance in F2 males. The evolutionary conservation of the DXMit216 region in mice and humans suggests a Cmv2-related mechanism may affect human antiviral responses.
Introduction
Human cytomegalovirus (HCMV) is a ubiquitous viral pathogen found throughout the world. The Center for Disease Control reports that over 60% of individuals by the age of 40 are infected with HCMV (CDC 2006). While most individuals display no overt symptoms of infection, HCMV can pose a serious threat to immunocompromised or immune suppressed individuals (Orange 2002; Rennekampff and Hamprecht 2006). Moreover, HCMV is the leading cause of congenital birth defects in the United States (Landolfo et al. 2003; Malm and Engman 2007). An important aim of ongoing research is to elucidate the mechanisms along with the molecular and genetic factors that regulate how the immune system can recognize and respond to CMV infection with effective virus control.
Early resistance to murine CMV (MCMV) infection has been extensively characterized in C57BL/6 mice to study the dominant Ly49H resistance factor and further examine host:pathogen interactions. Recently, we found that early resistance to MCMV infection in NZW mice requires NK cells, like B6 mice. However, NK-mediated control in NZW mice is Ly49H-independent (Rodriguez et al. 2004). In comparison, we found that NK cells in genealogically related NZB mice were unable to restrict MCMV replication; therefore, NZB mice were profoundly susceptible to infection. Genetic comparison of NZW- and NZB-like MCMV control traits in (NZW × NZB)F1 and F2 progeny revealed that NZW viral resistance was a non-dominant trait defined by multiple genetic factors (Rodriguez et al. 2004). Designated as Cmv2, this NZW MCMV control trait required NK cells, was Ly49H-independent and exhibited genetic complexity.
Quantitative trait locus (QTL) mapping has been successfully used to identify numerous loci underlying complex genetic traits such as obesity, malaria susceptibility and osteoporosis (Fortin et al. 2002; Ishimori et al. 2006; Ishimori et al. 2008; Kumazawa et al. 2007; Stylianou et al. 2006). Therefore, QTL analysis was employed to map loci affecting early spleen MCMV genome levels in New Zealand F2 offspring. We anticipated that loci in the Natural killer gene complex (NKC) on chromosome 6 and/or the major histocompatibility complex (MHC) on chromosome 17 would be associated with Cmv2. Surprisingly, genetic mapping analyses performed on an (NZW × NZB)F2 (WBF2) dataset identified significant QTL residing on chromosome X and outside the MHC on chromosome 17 near genetic markers DXMit216 (139.1 Mb, build 36) and D17Mit152 (65.2 Mb, build 36), respectively (Rodriguez et al. 2004). These results suggested that Cmv2 might be linked to loci containing novel MCMV resistance factors.
In this investigation, we confirm that the DXMit216 locus impacts MCMV control in New Zealand F2 mice. Surprisingly though, multiple F2 cohorts demonstrated that the NZB-derived DXMit216 (DXMit216nzb) allele conferred greater MCMV control in male, but not female F2 offspring. Other genomic loci likely contribute to DXMit216nzb-linked MCMV control since this locus by itself was not significantly associated with greater MCMV control in New Zealand F1 or NZW.NZB-DXMit216 congenic males. This study reveals the importance of chromosome X-linked genetic factors in Cmv2 immunity and identifies other potential genomic loci associated with MCMV resistance.
Materials and methods
Mice
NZW/LacJ, NZB/BINJ, and C57BL/6J mice were purchased from the Jackson Laboratory (Bar Harbor, ME) and maintained in the MR5 SPF vivarium at the University of Virginia (UVA), which is fully accredited by the American Association for Accreditation of Laboratory Animal Care. New Zealand F1 and F2 mice were bred and maintained at UVA. NZM88, NZM391, NZM2328, NZM2758 breeders were kindly provided by Dr. David Lawrence. NZW.NZB-DXMit216 and NZW.NZB-H2d were generated essentially as previously described (Dighe et al. 2005; Xie et al. 2007). Briefly, NZW.NZB-H2d and NZW.NZB-DXMit216 congenic mice were generated by backcrossing (NZW × NZB)F1 mice with NZW. Backcross offspring with select donor NZB H-2 loci (defined by simple sequence length polymorphism (SSLP) markers D17Mit16-D17Mit10) or chromosome X loci (DXUva03-rs13484113) were further separately backcrossed with NZW through four additional backcross generations. NZW.NZB-H2d (N6) and NZW.NZB-DXMit216 (N4-N6) generation mice were used in experiments. Animal protocols were approved and mouse experiments were conducted in accordance with Animal Care and Use Committee guidelines.
Virus assays
MCMV was propagated by serial passage of salivary gland stock virus (Smith strain, ATCC no. VR194) through weanling BALB/c mice as previously described (Rodriguez et al. 2004). Experimental MCMV stocks were titered on NIH3T3 monolayers in at least three independent experiments. Mice (8–12 wks) were i.p. infected with 1×10⁵ PFU of MCMV. Spleen and liver tissue samples were obtained from infected or control mice 3.5 days after infection. Tissue genomic DNA was isolated using the Puregene DNA isolation kit (Gentra Systems Inc. Minneapolis, MN). MCMV genome levels were quantified using quantitative real-time PCR (QPCR) as previously described (Rodriguez et al. 2004; Wheat et al. 2003). All sample measurements were performed in triplicate. Spleen and liver MCMV genome levels were reported as the Log10 (No. of CMV genome copies/No. endogenous β-actin genome copies) ratio.
Genotyping and genetic mapping of quantitative trait loci (QTL)
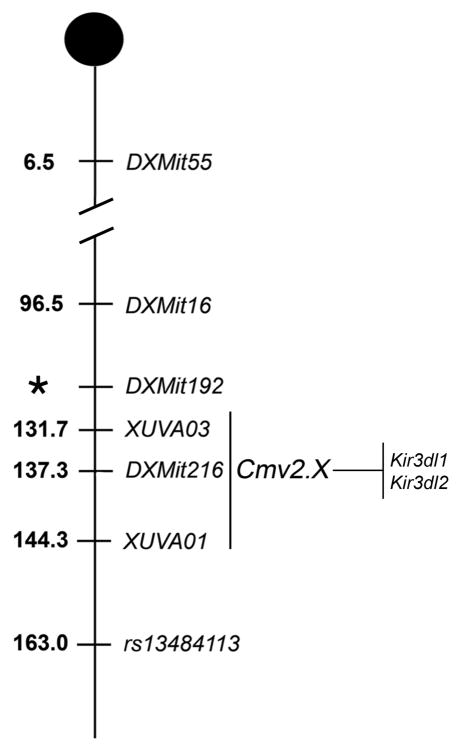
A panel of 84 fluorescent-labeled SSLP markers, including new DXMit216-flanking markers DXUva01 and DXUva03 (Figure 1), to distinguish NZW and NZB alleles was used to determine genome-wide genotypes for tissue DNA samples described above. SSLP amplification products were analyzed using the 3130xl Genetic analyzer using Data Collection (v3.0) and GeneMapper software (v4.0; Applied Biosystems, Foster City, CA). Interval mapping in R/qtl was calculated using the expectation maximization (EM) algorithm with a normal model on square root transformed MCMV trait values and using the non-parametric option. All QTL mapping analyses were performed using the WBF2 cohort I dataset (n = 183). A permutation test (1,000 permutations) performed on the WBF2 dataset determined QTL significance thresholds that were applied to the interval mapping analysis.
Figure 1.
A genetic map for Cmv2 on chromosome X. Depicted is chromosome X with useful SSLP and SNP genotype marker positions (megabases) indicated. DXMit192* was not included in build 36 for chromosome X.
Statistics
The Mann-Whitney (M-W) non-parametric test was used to compare MCMV genome levels in spleens of infected animals. The F-test and two-way analysis of variance (ANOVA) test were used to compare mean MCMV genome levels for males and females of the different F2 cohorts. The proportions of low or high virus containing male and female BWF2 mice were compared using a Chi square (χ2) test. New Zealand F2 trait values distributions stratified by sex and DXMit216 genotype were compared using the Kolmogorov-Smirnoff test (K-S). Statistical calculations were performed with Minitab (Minitab Inc, State College, PA), SAS 9.1 (SAS, Inc, Cary NC) and GAUSS 8.0 (Aptech Systems, Inc, Black Diamond, WA) statistics programs.
Results
A Cmv2 quantitative trait locus on chromosome X
Previously, we examined MCMV control in a cohort of 257 (NZW × NZB)F2 (WBF2) offspring; 119 of the 257 animals were genome-wide genotyped (Rodriguez et al. 2004). This analysis was extended to confirm previous genetic linkages to D17Mit152 and DXMit216 by examining 64 additional WBF2 mice. WBF2 genomes were genotyped and examined for resistance to MCMV infection as previously described (Rodriguez et al. 2004); spleen and liver virus genome levels were assessed using quantitative real-time PCR (QPCR). This extended analysis is comprised of MCMV-resistance traits and genome-typings for 183 infected WBF2 mice (referred to as cohort I: 99♀, 84♂).
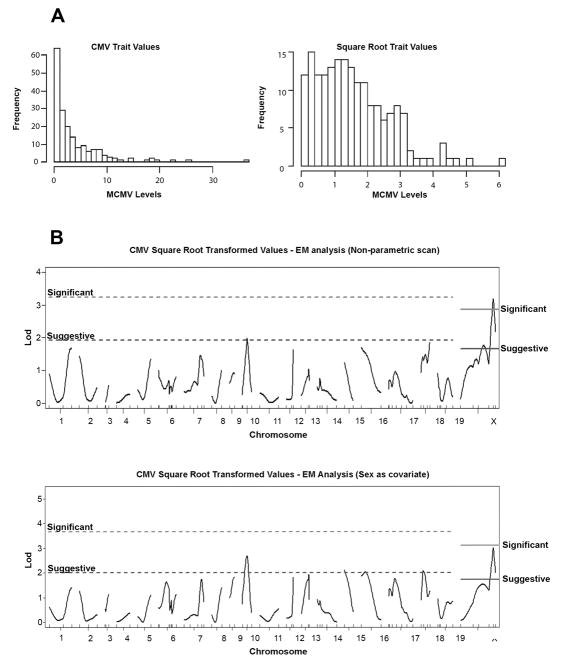
The R/qtl genetic mapping program incorporates sex and cross direction information in calculating QTL significance thresholds for chromosome X and the autosomes (Broman et al. 2006). The identity of the paternal grandmother (NZW) and the sex of each WBF2 mouse were included in the analysis. Since the MCMV trait values followed a non-normal distribution (Figure 2a), the WBF2 dataset (n=183) was analyzed with a non-parametric model and also square root transformed trait values. WBF2 interval mapping with a non-parametric option identified a significant QTL linked with DXMit216 (LOD = 3.18, X-chromosome 95% significance threshold is 2.86) on chromosome X (Figure 2a). A suggestive QTL linkage was observed at D10Mit10 on chromosome 10 (LOD = 1.98, autosomal suggestive threshold is 1.92), which was mapped previously (Rodriguez et al. 2004). Consistent with the above results, analyses performed with the square root transformed trait values (95% significance LOD = 3.11) presents a nearly significant QTL at DXMit216 (LOD = 3.02) (Figure 2b). Altogether, these findings substantiated a significant QTL near DXMit216 on chromosome X.
Figure 2.
R/qtl analysis of MCMV control trait values for WBF2 (cohort I) offspring. (a) Frequency plots for WBF2 (cohort I) MCMV trait values (left) or square root transformed trait values (right) are shown. Note that WBF2 trait values are not normally distributed. (b) LOD scores (top, WBF2 square root trait values with non-parametric option; bottom, square root transformed WBF2 values accounting for sex effects) obtained in R/qtl using the expectation maximization (EM) algorithm were plotted for the autosomes and chromosome X. Suggestive (37%) and significant (95%) thresholds are indicated.
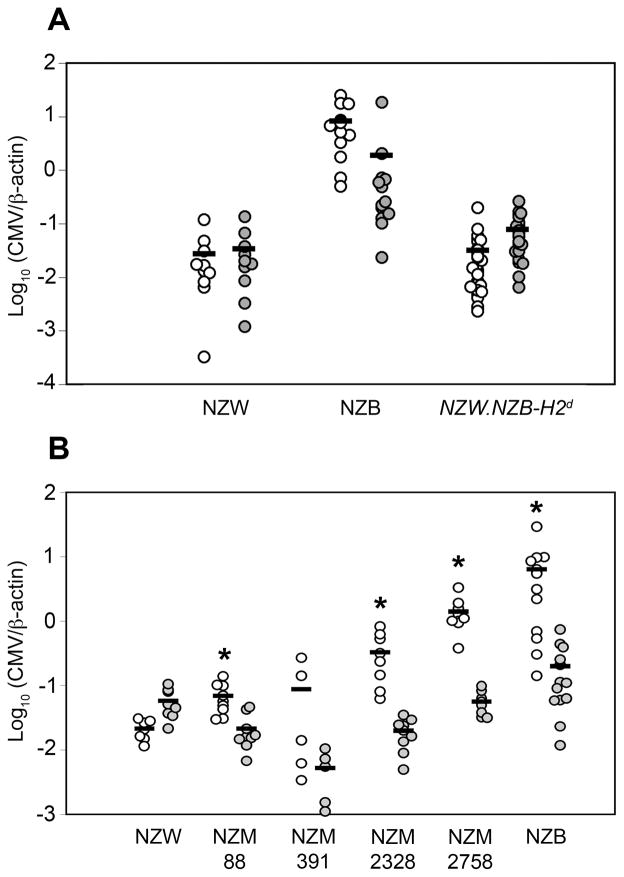
Curiously, no chromosome 17 SSLP markers were associated with Cmv2 resistance in these analyses. To support the latter findings, we also examined MCMV control in NZW.NZB-H2d congenic mice and several New Zealand mixed (NZM) strains, including NZM88, NZM391, NZM2328 and NZM2758 (Figure 3). As shown in Figure 3a, MCMV control in congenic NZW.NZB-H2d and NZW control mice was comparable. Thus, the MHC was not a significant factor in Cmv2 resistance. Additionally, average spleen MCMV genome levels in the NZM strains ranged between those observed in NZW and NZB controls (Figure 3b). Because each of the NZM strains inherited chromosome 17 from NZW (Supplementary figure 1) this finding further indicated that chromosome 17 loci were unlikely to greatly impact Cmv2 immunity.
Figure 3.
Assessment of early MCMV control in NZW.NZB-H2d congenic mice and inbred NZM mice. Shown are spleen (open) and liver (filled) MCMV QPCR values for individual NZW.NZB-H2d congenic mice (a) or NZM mice (b). Arithmetic mean values for each group are also shown. The student T-test revealed no significant differences in mean spleen MCMV genome levels between NZW and NZW.NZB-H2d mice. The Mann-Whitney test in (b) revealed that several mean NZM spleen MCMV genome levels were significantly higher (*, p < 0.01) than NZW.
Impact of sex on DXMit216-linked Cmv2 resistance
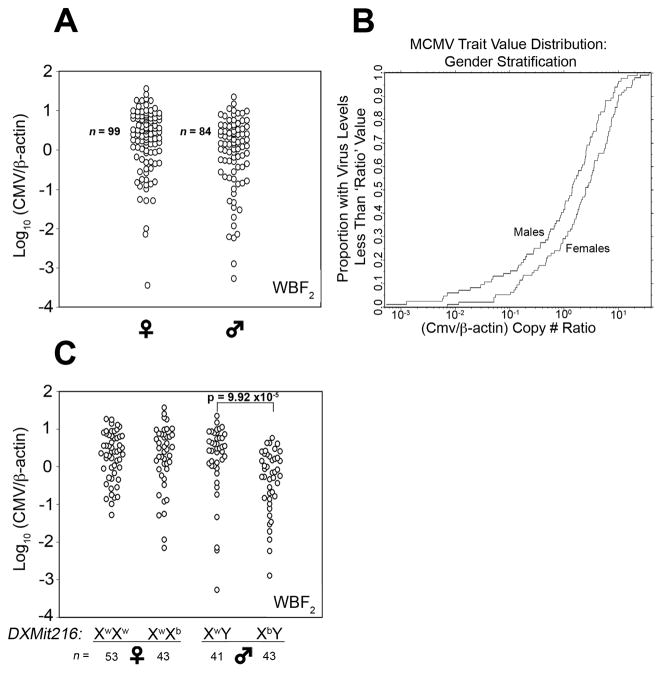
The chromosome X-linked QTL prompted a comparison of average spleen MCMV genome levels for WBF2 sex-segregated populations (99♀, 84♂). MCMV trait values were continuously distributed among the male and female groups (Figure 4a): however, the empirical distribution plots revealed that more WBF2 males than females had low spleen MCMV (Figure 4b). Roughly 40% of males had a CMV/β-actin copy number ratio less than 1.0 compared to only 25% of females. A similar but separate study with a cohort of 75 WBF2 mice (cohort II) yielded similar results (supplementary figure 2). These data indicated that WBF2 males limited spleen MCMV replication more effectively than females.
Figure 4.
Assessment of MCMV control trait values in sex- and DXMit216-stratified WBF2 offspring. (a) MCMV control trait values for individual WBF2 (cohort I) mice separately plotted for males and females are shown. (b) The proportion of WBF2 (cohort I) offspring with less than a given MCMV trait value was plotted. Statistical comparisons of MCMV control trait value distributions by sex were performed using the Mann-Whitney (M-W) and student T tests; p-values are shown. (c) MCMV trait values for WBF2 offspring stratified by sex and DXMit216 are shown. Statistical comparison of sex- and DXMit216-stratified mean MCMV control values was performed using the Mann-Whitney test.
Several strategies were then used to validate DXMit216 linkage with MCMV control in this system. First, cohort I WBF2 mice were stratified by sex and DXMit216 genotype for comparison of average spleen MCMV genome levels in each group. Since an NZW female was the paternal grandmother of the WBF2 mouse cross, only DXMit216nzw or DXMit216het females and hemizygous (DXMit216nzw/y or DXMit216nzb/y) males were produced (Figure 5a). As shown in Figure 4c, average spleen MCMV genome levels were comparable in DXMit216-stratified females. In contrast, we found that the average MCMV genome level was approximately 3-fold lower in DXMit216nzb/y males than in DXMit216nzw/y males or females. An effect plot generated for DXMit216 from our square root transformed data also indicated that a male-specific effect was attributed to chromosome X (Supplementary Figure 3). These data indicated that a DXMit216-linked QTL inherited from NZB restricted MCMV infection inWBF2 males.
Figure 5.
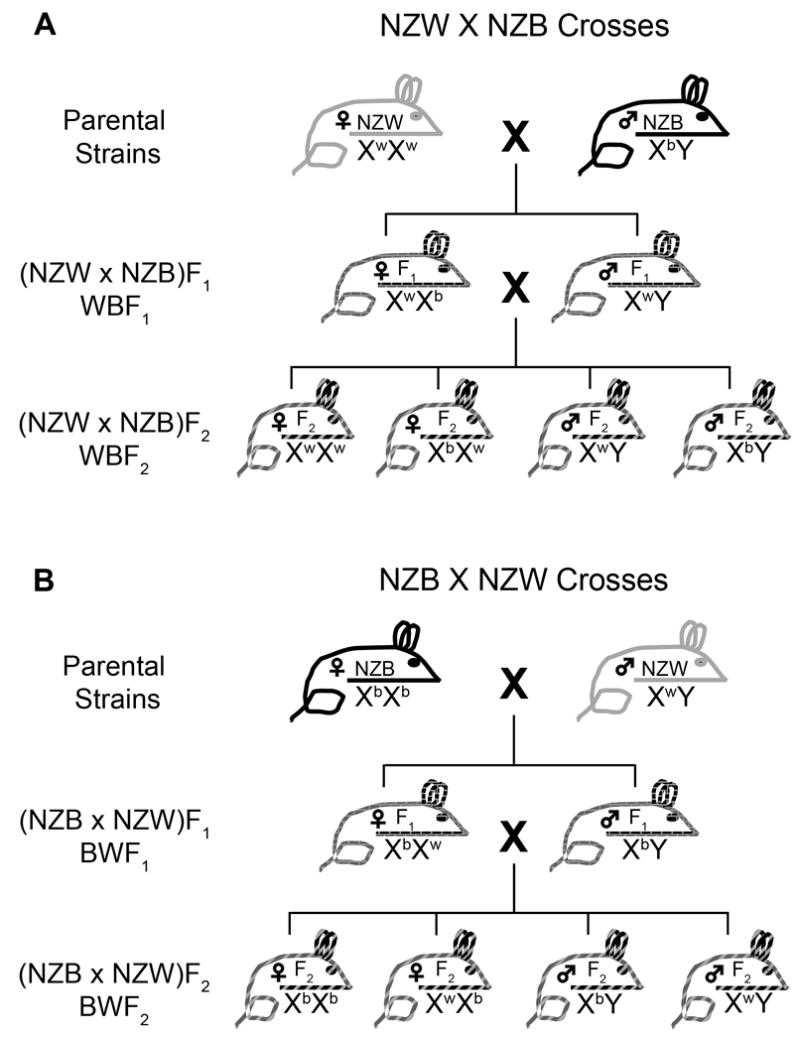
Schematic of chromosome X segregation in New Zealand crosses. Depiction of chromosome X segregation in NZW × NZB outcrosses, (a) and NZB × NZW outcrosses, (b). Note the differences in the chromosome X genotypes in WBF1 and BWF1 males and females and how this impacts the genotypes in the corresponding F2 progeny.
Next, MCMV control in WBF1 and BWF1 mice were compared. We hypothesized that genetically identical WBF1 and BWF1 females would display comparable MCMV control, whereas BWF1 (DXMit216nzb/y) males should display greater resistance than WBF1 (DXMit216nzw/y) males or females (Figure 5). As expected, spleen MCMV genome levels were comparable in F1 females (Supplementary Figure 4a). However, MCMV genome levels in BWF1 males were not significantly different from other male or female mice (Supplementary Figure 4a). Thus, DXMit216nzb-linked effects were not observed in F1 mice. This finding suggested that NZB susceptibility alleles might mask DXMit216nzb-linked effects on an F1 background. To circumvent this potential problem, NZW.NZB-DXMit216 congenic mice were generated with the expectation that introgression of the DXMit216nzb locus onto an NZW genetic background would confer greater MCMV resistance. However, virus control in the congenic males was comparable to littermate controls and NZW mice (Supplementary Figure 4b). Thus, DXMit216-linked QTL effects were not apparent when studied on F1 or NZW congenic backgrounds suggesting that other loci impact DXMit216nzb-linked Cmv2 resistance.
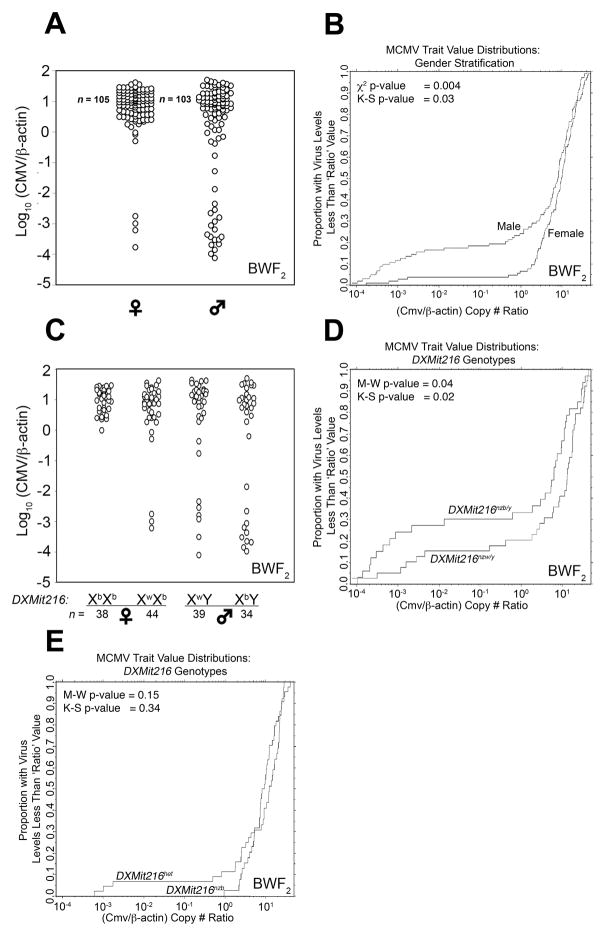
While traditional approaches to biologically authenticate a DXMit216-linked QTLproved difficult and because its effects were only evident in WBF2 males, we examined MCMV control in an independent F2 cohort outcrossed in the opposite (NZB × NZW)F2 (BWF2) genetic direction (Figure 5b). We hypothesized that BWF2 DXMit216nzb females and DXMit216nzb/y males would display effective MCMV control. As shown in Figure 6a, spleen MCMV genome levels were discontinuously distributed in sex-segregated BWF2 offspring, including sixteen males and four females with virus levels much lower than in all other BWF2 animals. It was unlikely that technical error could explain this outcome since most infected animals lost more than 5% body weight, including mice with very low spleen MCMV (Figures 7b and 7c). These body weight changes were consistent with those routinely observed in inbred controls (Figure 7a) and differed from uninfected mice whose body weights were unaffected (data not shown). Interestingly, a greater proportion of male offspring contained significantly lower spleen MCMV levels than females (Figures 6a and 6b).
Figure 6.
Assessment of MCMV control trait values in sex- and DXMit216-stratified BWF2 offspring. (a) MCMV control trait values for individual BWF2 mice separately plotted for males and females are shown. (b) The proportion of BWF2 offspring with less than a given MCMV trait value was plotted. Statistical comparisons of MCMV control trait value distributions by sex were performed using the M-W and Kolmogorov-Smirnov (K-S) tests; p-values are shown. (c) MCMV trait values for BWF2 offspring stratified by sex and DXMit216 are shown. Note that some BWF2 offspring were not typed with DXMit216. (d) The proportions of DXMit216nzb/y or DXMit216nzw/y BWF2 males with less than a given MCMV trait value were plotted. Statistical comparisons of MCMV control trait value distributions by DXMit216 genotype were performed with M-W and K-S tests; p-values are shown. (e) The proportion of DXMit216nzb or DXMit216het BWF2 females with less than a given MCMV trait value was plotted. Statistical comparisons of MCMV control trait value distributions by DXMit216 genotype were performed with M-W and K-S tests; p-values are shown.
Figure 7.
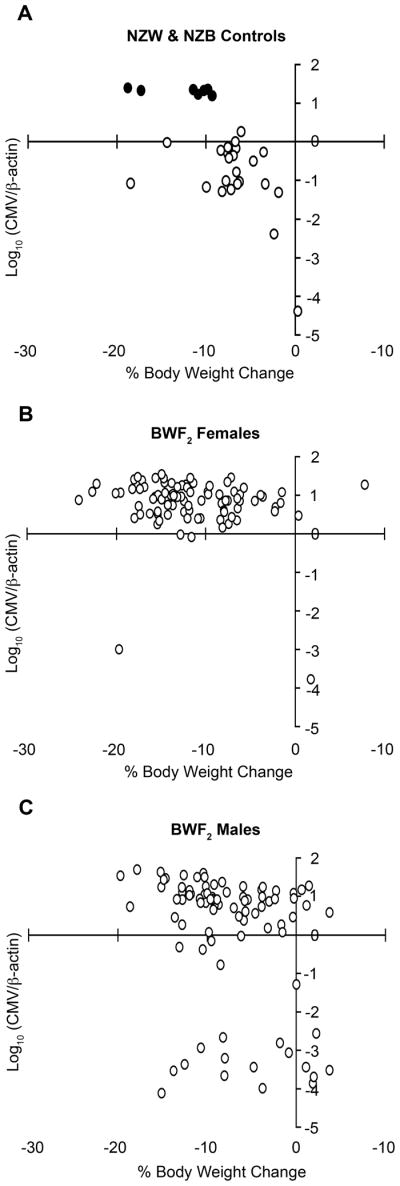
Assessment of body weight change in BWF2 offspring during acute MCMV infection. Shown are the percent body weight changes in a 3.5 day interval plotted against MCMV control trait values for infected NZW (empty) and NZB (filled) control mice (a), BWF2 females (b) and BWF2 males (c).
Since DXMit216nzb/y males had lower mean spleen MCMV genome levels than all other WBF2 groups (Figure 4c), a similar comparative analysis was performed after BWF2 offspring were stratified by sex and DXMit216 genotype. Here WBF2 and BWF2 datasets were analyzed separately since mice in the different cohorts were infected with distinct virus stock preparations given at different times and in different locations. Moreover, genome-wide genotype profiles were only ascertained for cohort I WBF2 offspring. Despite these caveats, we found low virus containing males in both DXMit216-segregated groups. Although not statistically significant, roughly 25% of DXMit216nzb/y males displayed a low-virus phenotype, compared with only 15.3% of DXMit216nzw/y males (Figure 6c). Comparison of DXMit216nzb/y and DXMit216nzw/y MCMV trait value distributions revealed that DXMit216nzb/y males contain a greater proportion of animals with low MCMV (Figure 6d). Thus, DXMit216-linked effects also significantly contributed MCMV-resistance in BWF2 males. Although the DXMit216het female population also contained animals with low MCMV, their trait value distributions were comparable to DXMit216nzb females (Figure 6e). We conclude that a DXMit216nzb-linked QTL affects Cmv2 immunity in F2 male progeny.
Statistical analysis of WBF2 and BWF2 cohort data
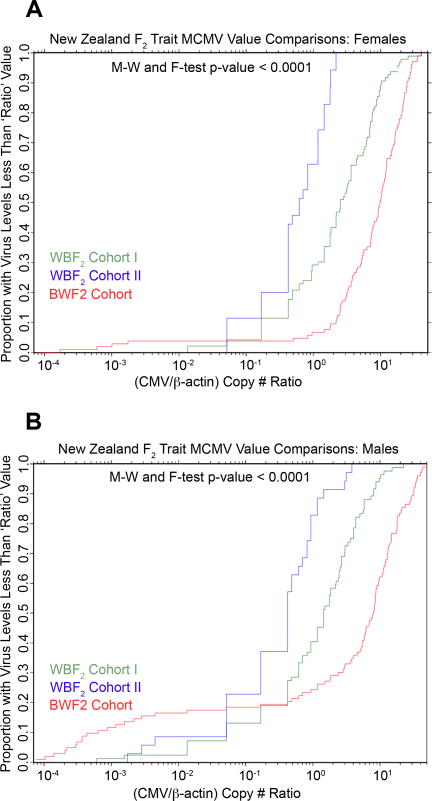
We next assessed whether the WBF2 andBWF2 MCMV trait values distributions actually differed. As shown in figure 8, empirical distribution plots comparing MCMV trait value distributions for females and males revealed significant differences between the F2 cohorts. Thus, a greater proportion of WBF2 cohort II offspring had trait values that were lower than a given virus control trait value (e.g. 1.0) than did WBF2 cohort I or BWF2 offspring (Figures 8a and 8b). In converse, a greater proportion of BWF2 offspring had higher trait values than offspring of either WBF2 cohort (Figure 8). Although the MCMV genome levels differed between cohorts this did not impact the differences between males and females as no significant interaction effect was found using the F-test (p-value = 0.44, data not shown), corroborating our previous sex-segregated comparisons. When the data from the three F2 cohorts was combined and analyzed using a two-way ANOVA test, the trait value distributions again differed significantly for males and females (p-value < 0.001, data not shown). We therefore conclude that New Zealand F2 males controlled early MCMV infection more efficiently than females and this was attributed, in part, to a DXMit216nzb-linked QTL.
Figure 8.
Comparison of MCMV control trait value distributions among three independent New Zealand F2 cohorts. The proportion of WBF2 cohorts I (green) and II (blue) and BWF2 (red) females (a) and males (b) with less than a given MCMV trait value were plotted. Statistical comparisons of MCMV control trait value distributions by cohort were performed using the M-W and F-tests. P-values are shown and represent the p-values obtained for all cohort comparisons.
The impact of NZW resistance factors on MCMV control was still apparent in WBF2 offspring. Comparison of sex-segregated trait value distributions for all three New Zealand F2 cohorts revealed that the WBF2 cohorts had a greater proportion of low-virus- containing animals than the BWF2 cohort (Figure 8a and b). For example, 65% and 30% of WBF2 cohort I and II females, respectively, had trait values lower than the CMV/β-actin ratio of 1.0. In contrast, less than 10% of BWF2 females had trait values less than 1.0. A similar trend was seen for BWF2 males. These data suggested that NZW female progenitors transferred unknown MCMV control factors to their WBF1 and WBF2 offspring endowing WBF2 progeny with more efficient MCMV control than their BWF2 counterparts.
Discussion
These studies confirm that a Cmv2 QTL linked to DXMit216 affects early MCMV control in New Zealand F2 offspring. Cmv2 bears several features that clearly distinguish it from other MCMV control loci, including Cmv1 (Ly49H), Cmv3 (Ly49P) and Cmv4 (an unknown Ly49pwk receptor?). A major difference in the New Zealand system is the lack of genetic evidence to support NKC or MHC linkage in the current study of three independent F2 cohorts. Cmv2 was instead marked by continuously distributed trait values in New Zealand F1 and F2 progeny and significant genetic linkage has so far only been mapped to DXMit216. Despite not having validated a DXMit216 QTL through use of traditional congenic approaches, analysis of multiple F2 genetic crosses confirmed its existence amidst additional potential modifier gene(s) on the NZB background that might inhibit its function.
Given that a DXMit216-linked effect(s) was most evident in F2 males, we speculated that body weight differences among males and females might explain the differences in MCMV control. Indeed, several QTL affecting body weight have been mapped to chromosome X. A major X-linked QTL (26.4 cM) associated with the capacity to efficiently convert feed into body mass has been shown to affect males and females (Liu et al. 2001). Its location on chromosome X apparently coincides with another body weight QTL designated Bw1 (Dragani et al. 1995), yet these loci are a great distance from DXMit216. Another X-linked QTL associated with body weight, Bw3, has been mapped to the same chromosome interval as Cmv2 (Dragani et al. 1995). Although we compared initial body weights with early MCMV control to delineate any potential associations, no correlation was found (data not shown). Further, as shown in Figure 7, we observed substantial body weight losses in males and females after MCMV infection that was independent of their spleen MCMV genome levels. Hence, it is unlikely that the DXMit216-linked QTL coincides with Bw3.
Several interesting loci linked to DXMit216 include mouse KIR-like (KIRL) sequences Kirl1, Kirl2 (Kir3dl2) and Kir3dl1 (Welch et al. 2003) which resemble killer immunoglobulin-like receptors (KIR), some of which bind MHC class I molecules as their ligands. When displayed by NK cells in human and other species, KIRs conduce NK cell self-tolerance, recognition of cellular targets and control of NK effector functions. Ly49 lectin-like NK cell receptors also bind MHC class I molecules and serve an analogous functional role in mice. Interestingly, KIR and Ly49 gene families have separately expanded in a polarized fashion in NK receptor gene complexes in human and mouse genomes, respectively (Kelley et al. (2005) PLoS Genet. 1(2): e27). In fact, only a single Ly49 pseudogene has been found within the human NK gene complex (NKC) on chromosome 12. Human KIR genes reside in the leukocyte receptor complex (LRC) on chromosome 19. Mouse Ly49 genes reside on chromosome 6 in the NKC and the mouse LRC on chromosome 7 lacks KIR gene sequences (Kelley 2005). Altogether, these features hinted that combined expression of KIR and Ly49 receptors might be incompatible or even detrimental. This speculation however has been proved incorrect since several mammalian species express both KIR and Ly49 receptors (Kelley et al. 2005 and Brown and Scalzo, 2008).
It is somewhat curious that KIRL sequences are absent from the corresponding region on human chromosome X, given that KIRL-flanking genes are conserved in human and mouse (Wilson et al. 2007). A distinct possibility is that an ancestral mouse KIR translocated to chromosome X and evolved to serve a role other than MHC class I surveillance (Wilson et al. 2007). Nonetheless, KIRL1 transcripts have been detected in CD44+CD25− thymocytes and IL-2 activated NK cells (Welch et al. 2003). Recently, KIRL1 protein was detected on the surface of BALB/c NK cells with the anti-KIRL1 mAb 6G10 (Wilson et al. 2007). Kir3dl1 encodes an inhibitory NK receptor that likely represents an allele of kirl1 expressed in some inbred mouse strains (Hoelsbrekken et al. 2003; Wilson et al. 2007). Thus, these DXMit216-linked genes could potentially impact innate immune responses toward viruses and represent sensible positional candidates for a Cmv2 QTL on chromosome X. Formal studies are underway to evaluate whether any of these candidate genes display polymorphisms or differences in gene expression between NZW and NZB mice.
In conclusion, Cmv2 is a complex genetic trait defined by multiple genetic factors including a chromosome X-linked QTL near DXMit216. Enhanced MCMV-resistance in New Zealand F2 males was conferred by a DXMit216nzb allele whose effects are likely impacted by an additional gene(s) on the NZB background. Detection of a DXMit216nzb-linked effect(s) in multiple independent New Zealand F2 crosses provided us with QTL linkage confirmation consistent with the guidelines of the complex trait consortium that was comparable to selective (genotype- or phenotype-driven) congenic breeding approaches (Abiola et al. 2003).
Supplementary Material
Acknowledgments
This work was supported by NIH grants AI050072 (MGB), AR045222 (S.M. Fu and MGB), GM070683 (GC and QL). M. Rodriguez received support from an NIH Research Supplement to Promote Diversity (AI050072-06S1). We thank Drs. Victor Engelhard, Marcia McDuffie, Shu Man Fu and Skip Virgin and members of the Brown lab for helpful discussion and comments on the manuscript. We also thank Dr. Mark Conway for expert statistical analyses.
Footnotes
Publisher's Disclaimer: This is an author-produced version of a manuscript accepted for publication in Mammalian Genome. Mammalian Genome holds the copyright to this manuscript. The original publication is available at www.springerlink.com/content/c126m61846783871/.
References
- Abiola O, et al. The nature and identification of quantitative trait loci: a community’s view. Nat Rev Genet. 2003;4:911–916. doi: 10.1038/nrg1206. [DOI] [PMC free article] [PubMed] [Google Scholar]
- Broman KW, et al. The X chromosome in quantitative trait locus mapping. Genetics. 2006 doi: 10.1534/genetics.106.061176. [DOI] [PMC free article] [PubMed] [Google Scholar]
- CDC. Cytomegalovirus 2006 [Google Scholar]
- Dighe A, et al. Requisite H2k role in NK cell-mediated resistance in acute murine cytomegalovirus-infected MA/My mice. J Immunol. 2005;175:6820–6828. doi: 10.4049/jimmunol.175.10.6820. [DOI] [PubMed] [Google Scholar]
- Dragani TA, et al. Mapping of body weight loci on mouse chromosome X. Mamm Genome. 1995;6:778–781. doi: 10.1007/BF00539002. [DOI] [PubMed] [Google Scholar]
- Fortin A, et al. Complex genetic control of susceptibility to malaria in mice. Genes Immun. 2002;3:177–186. doi: 10.1038/sj.gene.6363841. [DOI] [PubMed] [Google Scholar]
- Hoelsbrekken SE, et al. Cutting edge: molecular cloning of a killer cell Ig-like receptor in the mouse and rat. J Immunol. 2003;170:2259–2263. doi: 10.4049/jimmunol.170.5.2259. [DOI] [PubMed] [Google Scholar]
- Ishimori N, et al. Quantitative trait loci that determine BMD in C57BL/6J and 129S1/SvImJ inbred mice. J Bone Miner Res. 2006;21:105–112. doi: 10.1359/JBMR.050902. [DOI] [PubMed] [Google Scholar]
- Ishimori N, et al. Quantitative trait loci for BMD in an SM/J by NZB/BlNJ intercross population and identification of Trps1 as a probable candidate gene. J Bone Miner Res. 2008;23:1529–1537. doi: 10.1359/JBMR.080414. [DOI] [PMC free article] [PubMed] [Google Scholar]
- Kumazawa M, et al. Searching for genetic factors of fatty liver in SMXA-5 mice by quantitative trait loci analysis under a high-fat diet. J Lipid Res. 2007;48:2039–2046. doi: 10.1194/jlr.M700222-JLR200. [DOI] [PubMed] [Google Scholar]
- Landolfo S, et al. The human cytomegalovirus. Pharmacol Ther. 2003;98:269–297. doi: 10.1016/s0163-7258(03)00034-2. [DOI] [PubMed] [Google Scholar]
- Liu X, et al. Characterization of a major X-linked quantitative trait locus influencing body weight of mice. J Hered. 2001;92:355–357. doi: 10.1093/jhered/92.4.355. [DOI] [PubMed] [Google Scholar]
- Malm G, Engman ML. Congenital cytomegalovirus infections. Semin Fetal Neonatal Med. 2007;12:154–159. doi: 10.1016/j.siny.2007.01.012. [DOI] [PubMed] [Google Scholar]
- Orange JS. Human natural killer cell deficiencies and susceptibility to infection. Microbes Infect. 2002;4:1545–1558. doi: 10.1016/s1286-4579(02)00038-2. [DOI] [PubMed] [Google Scholar]
- Rennekampff HO, Hamprecht K. Cytomegalovirus infection in burns: a review. J Med Microbiol. 2006;55:483–487. doi: 10.1099/jmm.0.46079-0. [DOI] [PubMed] [Google Scholar]
- Rodriguez MS, et al. Cmv1-independent antiviral role of NK cells revealed in murine cytomegalovirus-infected New Zealand White mice. J Immunol. 2004;173:6312–6318. doi: 10.4049/jimmunol.173.10.6312. [DOI] [PubMed] [Google Scholar]
- Stylianou IM, et al. Quantitative trait locus analysis for obesity reveals multiple networks of interacting loci. Mamm Genome. 2006;17:22–36. doi: 10.1007/s00335-005-0091-2. [DOI] [PubMed] [Google Scholar]
- Welch AY, et al. Identification of the mouse killer immunoglobulin-like receptor-like (Kirl) gene family mapping to chromosome X. Immunogenetics. 2003;54:782–790. doi: 10.1007/s00251-002-0529-6. [DOI] [PubMed] [Google Scholar]
- Wheat RL, et al. Quantitative measurement of infectious murine cytomegalovirus genomes in real-time PCR. J Virol Methods. 2003;112:107–113. doi: 10.1016/s0166-0934(03)00197-6. [DOI] [PubMed] [Google Scholar]
- Wilson EB, et al. Expression of murine killer immunoglobulin-like receptor KIRL1 on CD1d-independent NK1.1(+) T cells. Immunogenetics. 2007;59:641–651. doi: 10.1007/s00251-007-0216-8. [DOI] [PubMed] [Google Scholar]
- Xie X, et al. Deficient major histocompatibility complex-linked innate murine cytomegalovirus immunity in MA/My.L-H2b mice and viral downregulation of H-2k class I proteins. J Virol. 2007;81:229–236. doi: 10.1128/JVI.00997-06. [DOI] [PMC free article] [PubMed] [Google Scholar]
Associated Data
This section collects any data citations, data availability statements, or supplementary materials included in this article.


