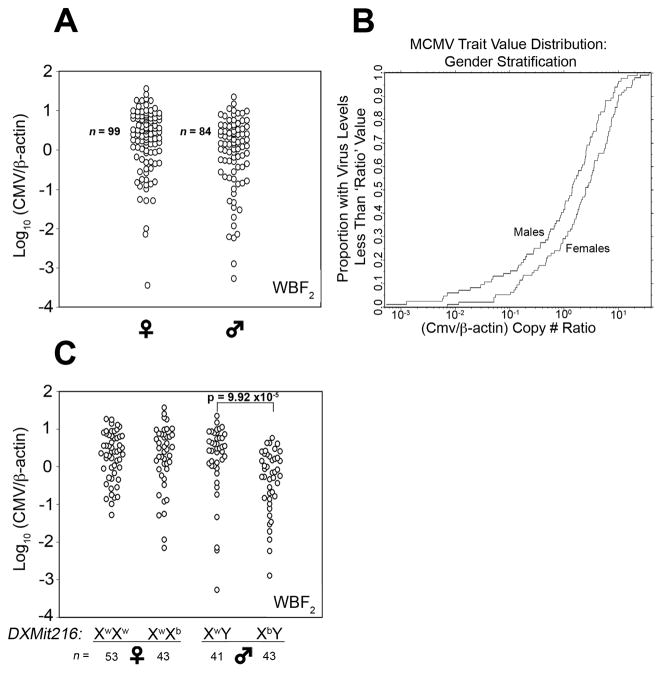
Figure 4.
Assessment of MCMV control trait values in sex- and DXMit216-stratified WBF2 offspring. (a) MCMV control trait values for individual WBF2 (cohort I) mice separately plotted for males and females are shown. (b) The proportion of WBF2 (cohort I) offspring with less than a given MCMV trait value was plotted. Statistical comparisons of MCMV control trait value distributions by sex were performed using the Mann-Whitney (M-W) and student T tests; p-values are shown. (c) MCMV trait values for WBF2 offspring stratified by sex and DXMit216 are shown. Statistical comparison of sex- and DXMit216-stratified mean MCMV control values was performed using the Mann-Whitney test.

