
Figure 4.
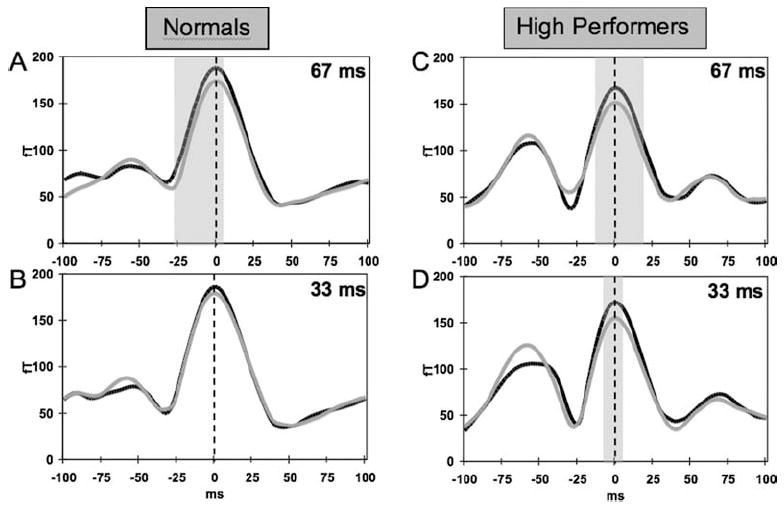
Average recentered waveforms (see Methods) in right hemisphere face-sensitive sensors for the two groups of subjects for the four conditions. Panels A and B show average waveforms for the group of normals for the 67- and 33-ms target durations, respectively. Panels C and D show data for the group of high performers for the 67- and 33-ms conditions, respectively. Black traces are for fearful targets and gray traces are for neutral targets. Vertical dashed line indicates location of M170 peak. Y-axis shows waveform amplitude in femtoTesla (fT) and x-axis shows time around peak of M170 response in milliseconds (ms). Shaded areas indicate time points at which difference between fearful and neutral target faces was significant (p < .05).