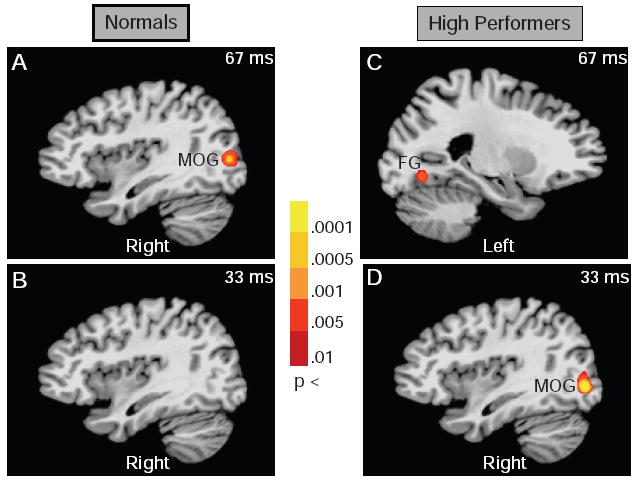
Figure 5.

SAMerf results: Images show paired t test comparison of SAMerf volumes of M170 evoked response for fearful versus neutral target faces. Panels A and B show SAMerf results for group of normals for 67-and 33-ms conditions, respectively. Panels C and D show SAMerf data for group of high performers for 67- and 33-ms conditions, respectively. Threshold for paired t test: p < .01 (corrected). Frequency band: 1–30 Hz; Active window: 40-ms adaptive window around M170 for each subject; Control window: −115 ms to 75 ms prestimulus baseline. In panels A and D, significant sources were localized to the right medial occipital gyrus (MOG) and in panel C to the left fusiform gyrus (FG).
