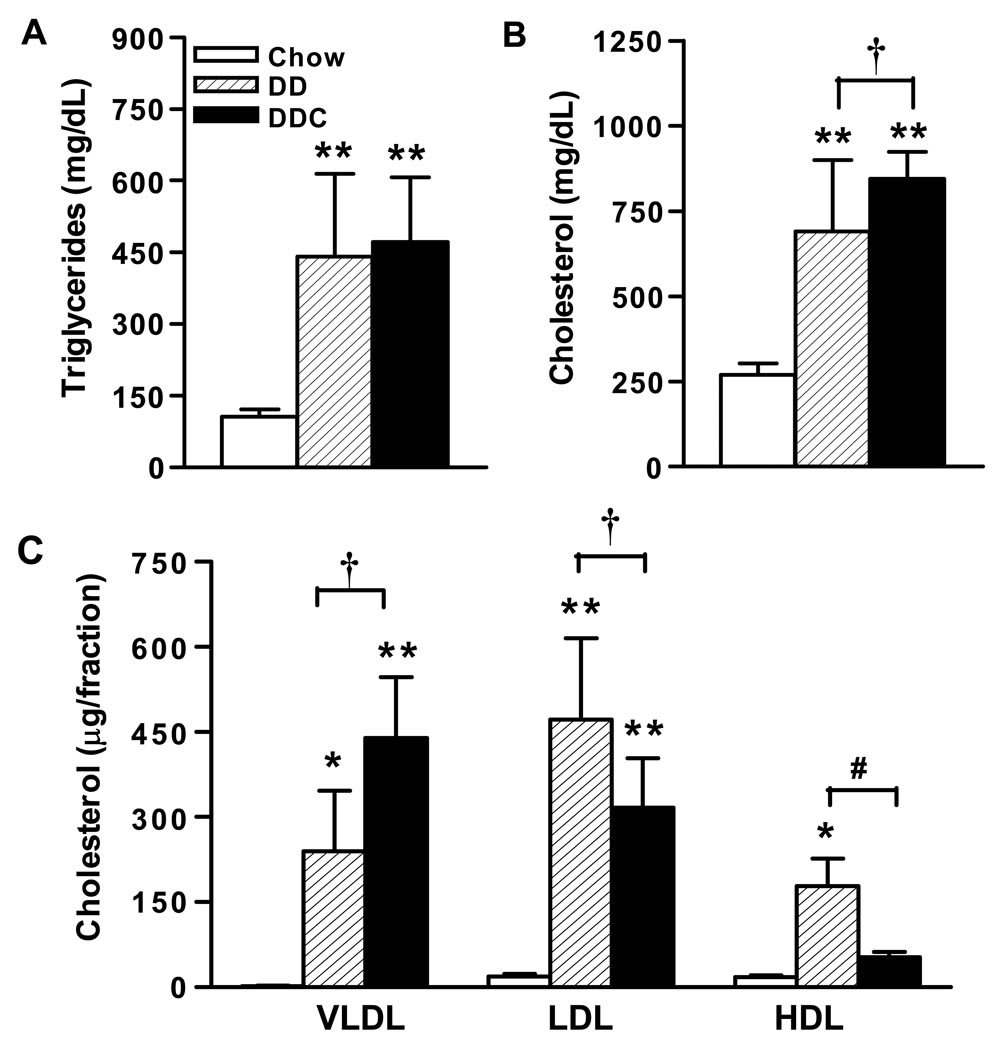
Figure 2. Effect of feeding diabetogenic diets in LDLR-/- mice on lipids and lipoproteins.
(A) Plasma triglyceride, (B) Plasma cholesterol, (C) Lipoprotein distribution after 24 weeks of feeding diets. n=10 for chow, n=15 for DD and DDC groups. FPLC profiles shown in Figure 6. *p<0.05 vs chow, **p< 0.001 vs chow, †p<0.05 vs DD, #p <0.01 vs DD. Values represent means±SD.

