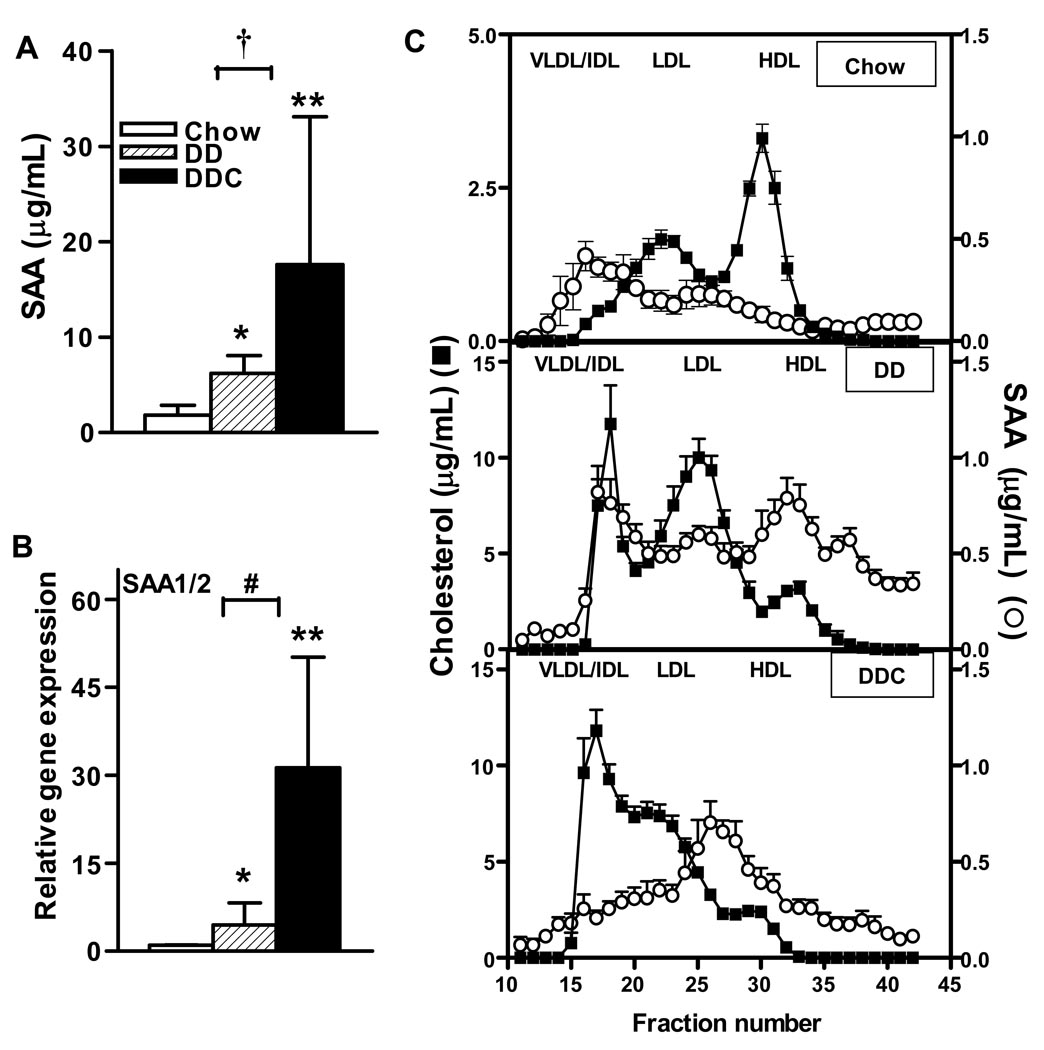
Figure 5. Circulating SAA levels are increased in LDLR-/- mice fed the diabetogenic diet and further increased with the addition of dietary cholesterol.
(A) SAA levels (B) mRNA levels of hepatic isoforms SAA1/2, (C) Lipoprotein distribution of SAA and cholesterol in chow (top), DD (middle) or DDC (bottom) groups. n=3–6 animals/group. *p<0.05 vs chow, **p<0.001 vs chow, †p<0.05 vs chow and #p<0.01 vs DD. Values represent means±SD.

