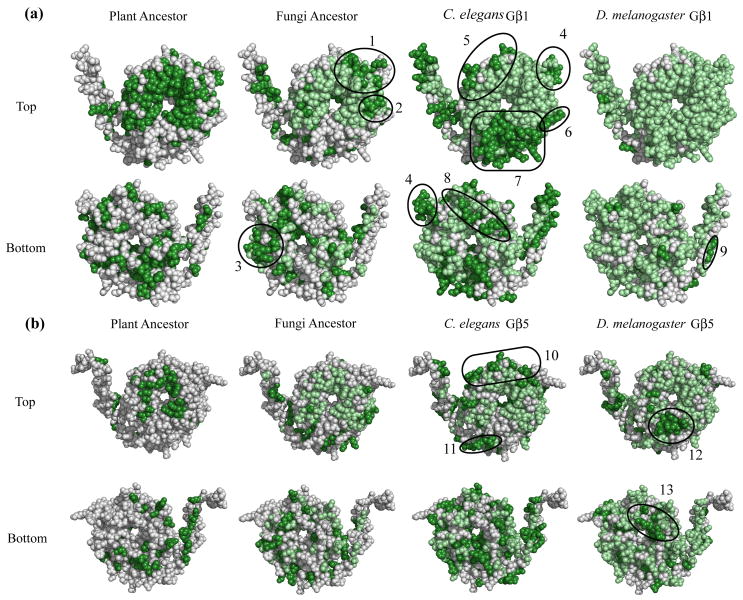
Fig. 4. Gβ regions of interest as determined by a comparative evolutionary analysis.
Three views (top, bottom, side) of the evolution of conserved regions in the plant ancestor, fungal ancestor, C. elegans Gβ, and D. melanogaster Gβ (a, Gβ1 [1got.pdb] and b, Gβ5 [2pbi.pdb]). The dark green regions of the plant ancestor highlight primordial function and form region of interest (ROI) 0. In all other organisms, newly conserved residues (those that matched the mammalian value) were colored dark green, while conserved residues present in a previous organism were colored light green. Thus, dark green patches represent acquisition of new function. ROIs are indicated and corresponding residues are listed in Table 1.

