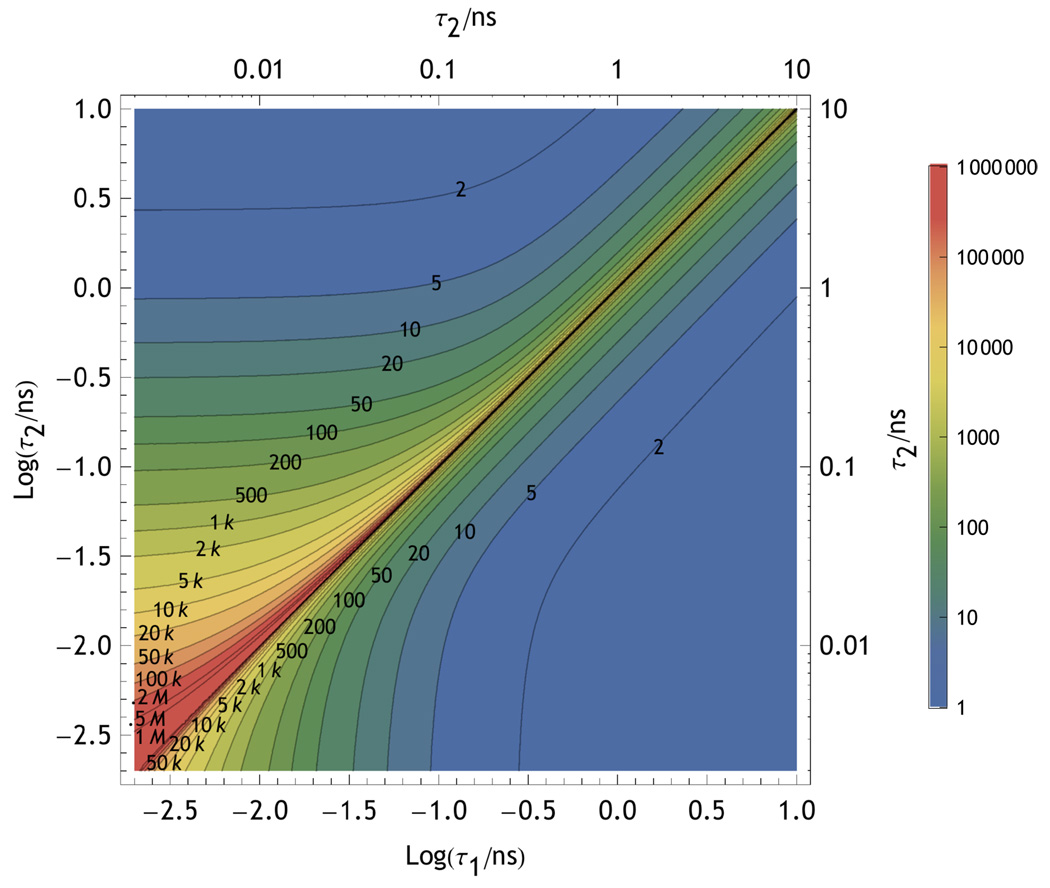
FIG. 12.
Contours of constant photon number as labeled on the figure that give  (𝕊, 𝕆) equivalent to 95% likelihood of distinguishing two dyes (or states) with lifetimes τ1 and τ2. The contours above the diagonal include the effects of a w=1 ns Gaussian instrument response whereas those below the diagonal include a w=100 ps Gaussian IRF. The green zone on the plot shows the ideal region for single molecule measurements.

