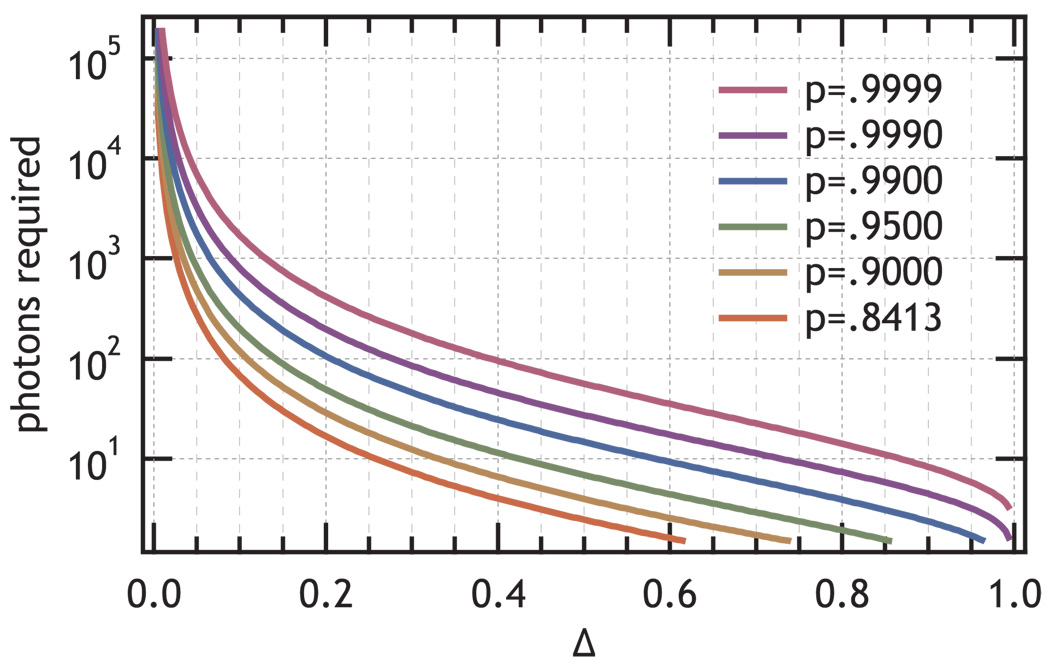
FIG. 3.
Contours of constant information evaluated for different values of Δ and p for  (𝕊,𝕆) equivalent to a likelihood, p, of determining a state, as indicated in the figure, that show the number of photons required to resolve two states that differ by Δ as defined by Eq. 12. The green p=0.95 line (n ≍ (ln(2)
 (𝕊, 𝕆))−1) is used to convert information per photon to number of photons required for p=0.95.

