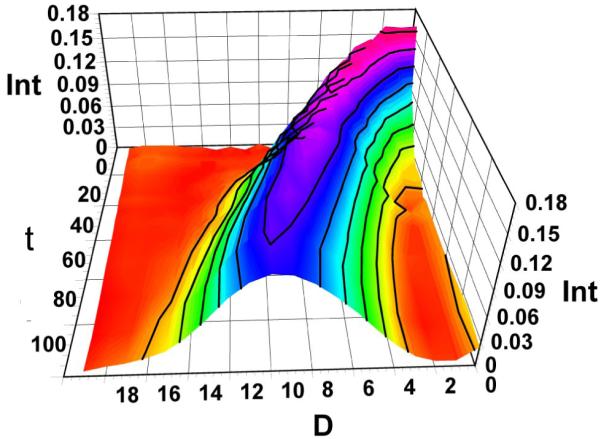
Figure 3.

3D plot of the evolution of D-distribution as a function of time for 2 h following mixing in n-propanol-OD. Removing the native C-13 isotope distribution from the data at all the time points reveals an envelope that represents the deuterium distribution. Int is signal intensity, D is the number of deuteria taken up by the dimer, and t is the time of exchange in min.
