
Figure 4. Analysis of the FεA:T Base Pair.
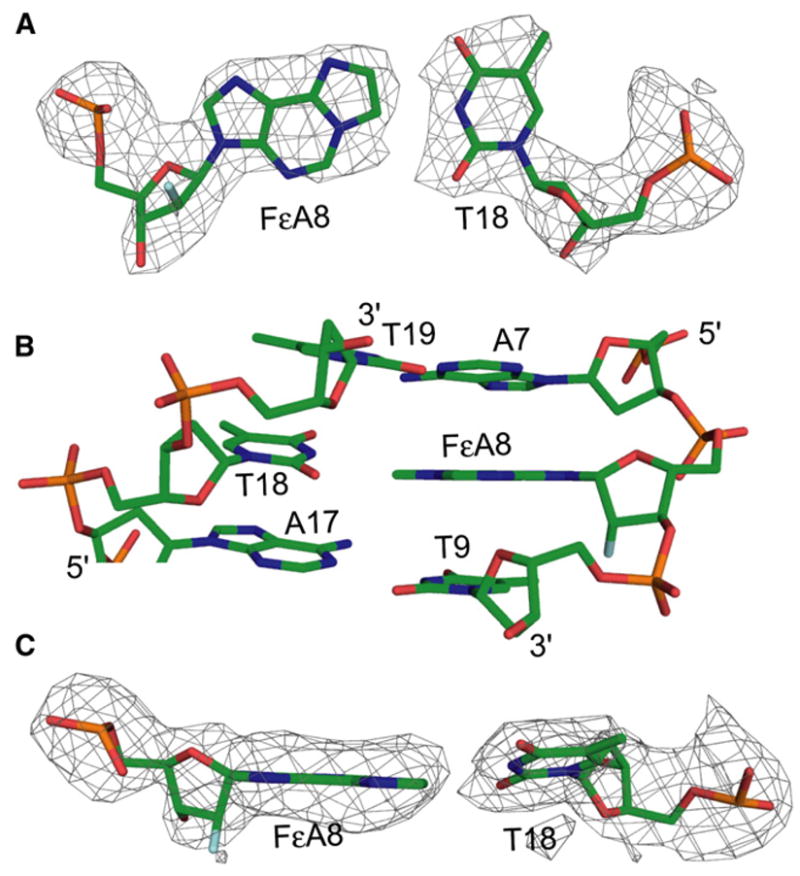
(A) Stick representation of the FεA:T base pair. The color scheme is the same as in Figure 3. The Fo − Fc electron density map of the base pair is represented as a mesh contoured at 3σ.
(B) FεA:T and the neighboring base pairs. The color scheme is as in Figure 3.
(C) The FεA:T base pair as viewed from the major groove, illustrating the propeller twist angle of T18. The color scheme and electron density map are as in (A).