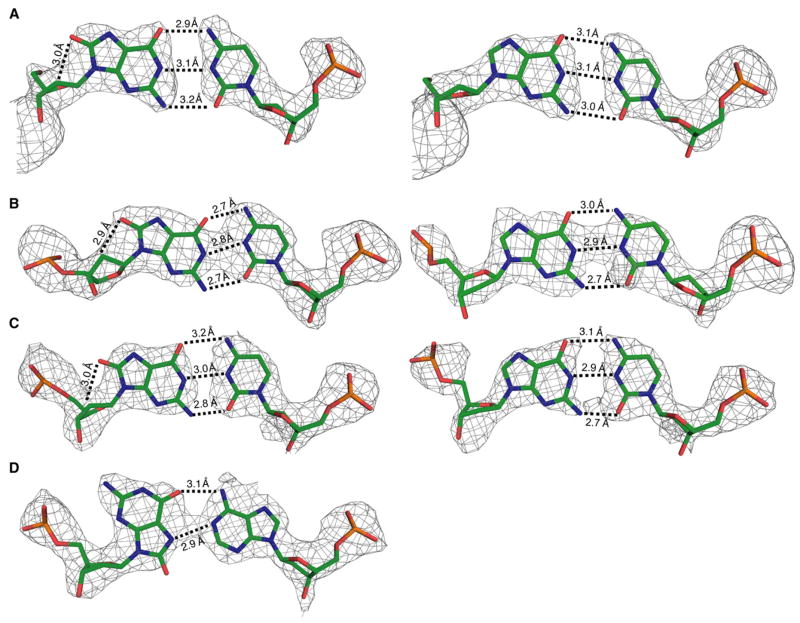
Figure 5. B-Form DNA Containing oxoG:dA or oxoG:dC Base Pairs.
(A–C) The oxoG:C base pairs (left column) with oxoG in the (A) one position, (B) six position, and (C) eight position within the DNA duplex. In the right column, G:C structures in the same positions within the DNA as the respective lesion are shown.
(D) Structure of oxoG base paired with adenine. The color scheme, Fo − Fc electron density map and hydrogen bonding are represented as in Figure 3.

