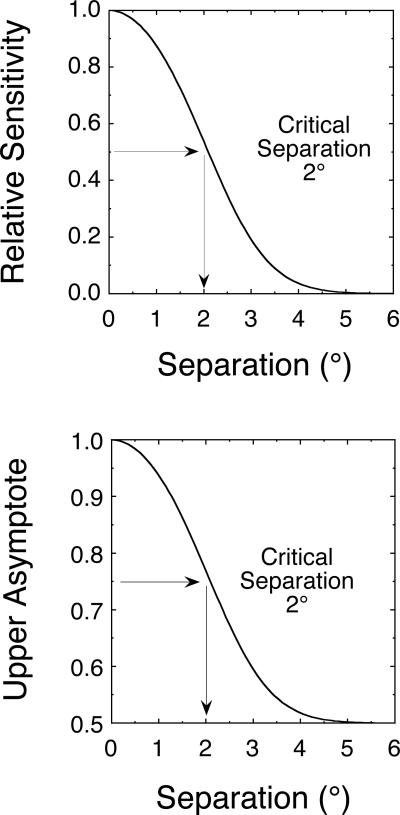
Figure 12.
Functions analogous to spatial tuning functions are illustrated that are appropriate for two different models of the selection process. In the top panel, relative sensitivity is plotted as a function of separation. This is an example of a spatial sensitivity function. In the bottom panel, upper asymptote is plotted as a function of separation. This is a spatial asymptote function that is appropriate to the all-or-none mixture model.

