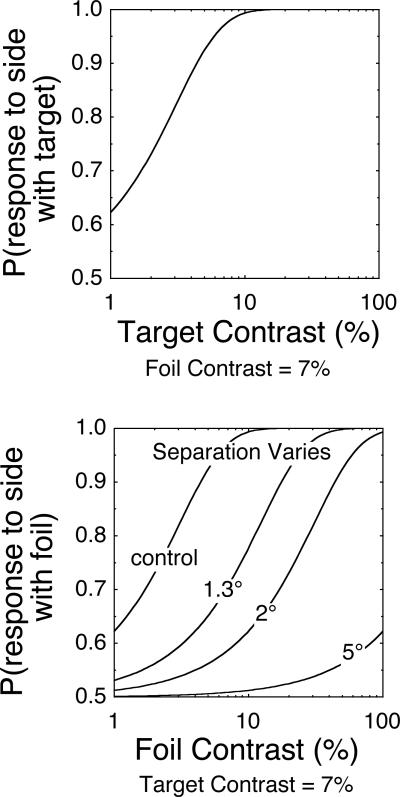
Figure 4.
The predictions of the contrast gain model are shown for the target and foil psychometric functions. The top panel is the target psychometric function with a typical function. The bottom panel is the foil psychometric function. Several functions are shown for different separations and for the target as a control. The contrast gain model predicts that the foil functions shift horizontally on a log contrast axis.

