Figure 1.
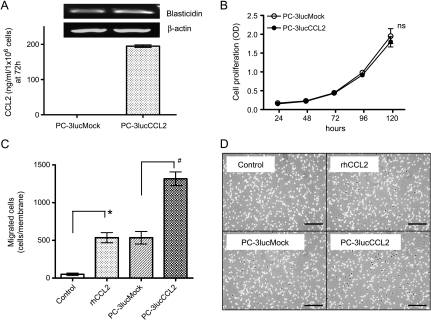
Characterization of CCL2 overexpression PC-3luc cells in vitro. (A) Expression of CCL2 in PC-3luc cell. Vectors' transfection was detected by reverse transcription-PCR (upper panels). The quantification of CCL2 secretion in supernatant was detected by ELISA (lower panel). Values represent mean ± SD. (B) In vitro growth of PC-3lucMock and PC-3lucCCL2 with complete medium. Cell proliferation was analyzed by WST-1 assay. Values represent mean ± SD (ns, not significant). (C) Mouse PBMC migration was analyzed in response to rhCCL2 (100 ng/ml), PC-3lucMock, and PC-3lucCCL2 conditioned medium. The number of cells per whole membrane was manually counted by microscopy. Columns: *P < .05 compared with control, #P < .05 compared with PC-3lucMock. Bars, SD. (D) Representative pictures of migrated cells. Clockwise; control, rhCCL2 (100 ng/ml), conditioned medium from PC-3lucCCL2 and conditioned medium from PC-3lucMock. Bars, 200 µm.

