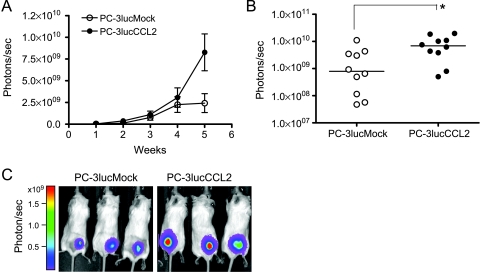
Figure 2.
In vivo growth of PC-3lucMock and PC-3lucCCL2. (A) Local tumor xenografts were established by subcutaneous injection of PC-3lucMock and PC-3lucCCL2 to SCID mice (n = 10 mice per group), and tumor growth was monitored as described in Materials and Methods. Values represent mean ± SEM. (B) Scatter plots of photons per second from PC-3lucMock and PC-3lucCCL2 on the fifth week. Values represent median (*P < .05). (C) Representative pictures illustrate week 5 images from each group (left panel, PC-3lucMock; right panel, PC-3lucCCL2).

