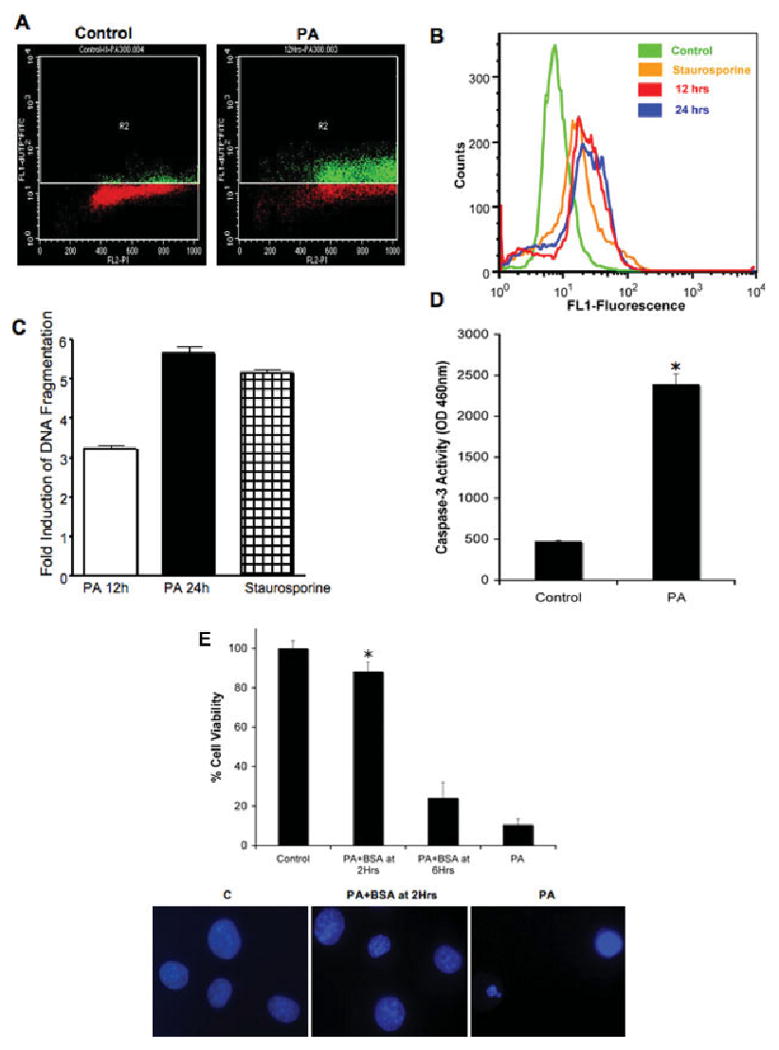
Fig. 2.

DNA fragmentation and caspase-3 activity of NGFDPC12 cells exposed to PA. A: Representative experimental results of BRDU-FITC plots (apoptotic cells) vs. PI (total DNA marker) for controls and cells exposed to PA/BSA (2:1) for 12 hr. The R2 quadrant shows cells exhibiting increased BrdU-FITC fluorescence (green). Nonapoptotic cells are indicated in red. B: Representative distribution diagram of positive apoptotic NGFDPC12 cells. Cells were treated with BSA for negative control (green), PA/BSA (2:1) for 12 hr (red) or 24 hr (blue), or staurosporine for positive control (orange). C: Quantitative analysis of positive apoptotic NGFDPC12 cells as shown in B. The data represent the mean ± SEM of three independent experiments done in triplicate. D: Caspase-3 activity in cell extracts was determined in control or NGFDPC12 cells treated with PA/BSA for 12 hr. E: Early posttreatment with BSA protects NGFDPC12 cells from PA-induced lipotoxicity. Additional BSA (0.6 mM final concentration) was added to NGFDPC-12 cells at 2 or 6 hr after initial PA/BSA (2:1 ratio) treatment. Percentage of viable cells was measured by the WST-1 assay at the end of a 24-hr incubation period. Nuclei in bottom panel were visualized with Hoechst staining. Data represent mean ± SEM of three independent experiments. ★P < 0.05 compared with control.
