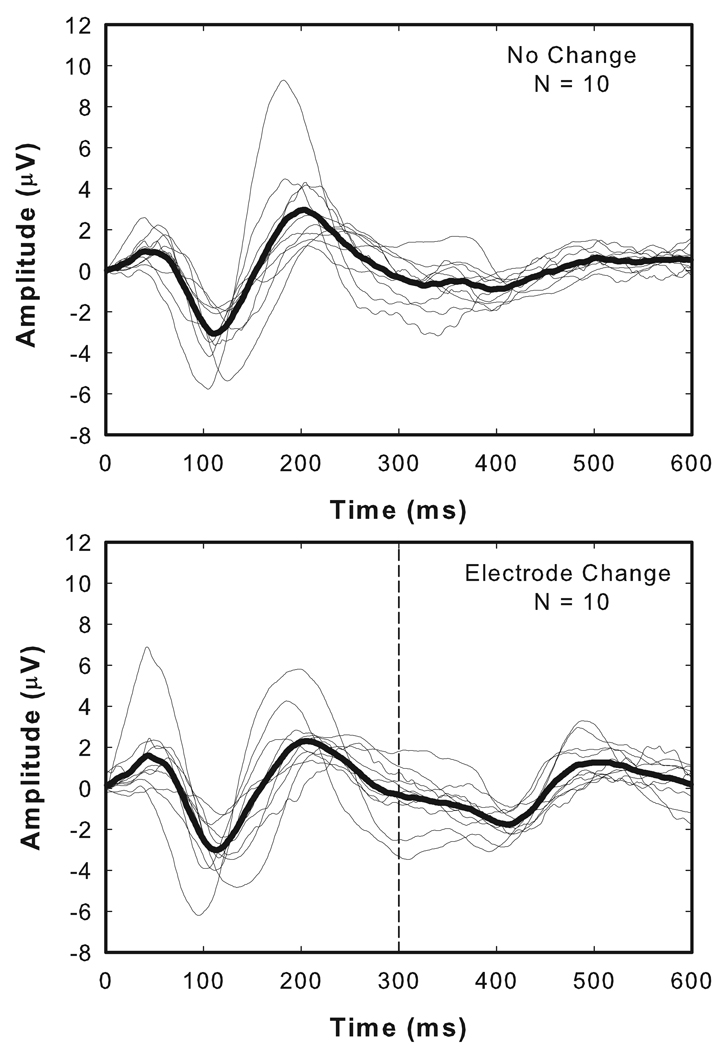
Figure 2.
Thin lines represent waveforms recorded from each of the 9 adult study participants (10 ears). The thick line is the group mean average waveform. The upper panel is a control condition. The lower panel shows recordings from the same set of individuals. In this case, the stimulation level was held constant but 300 ms after stimulation began, the stimulating electrode was changed. In each case, the change was to an electrode located 4–5 electrodes apical to the initial stimulating electrode.

