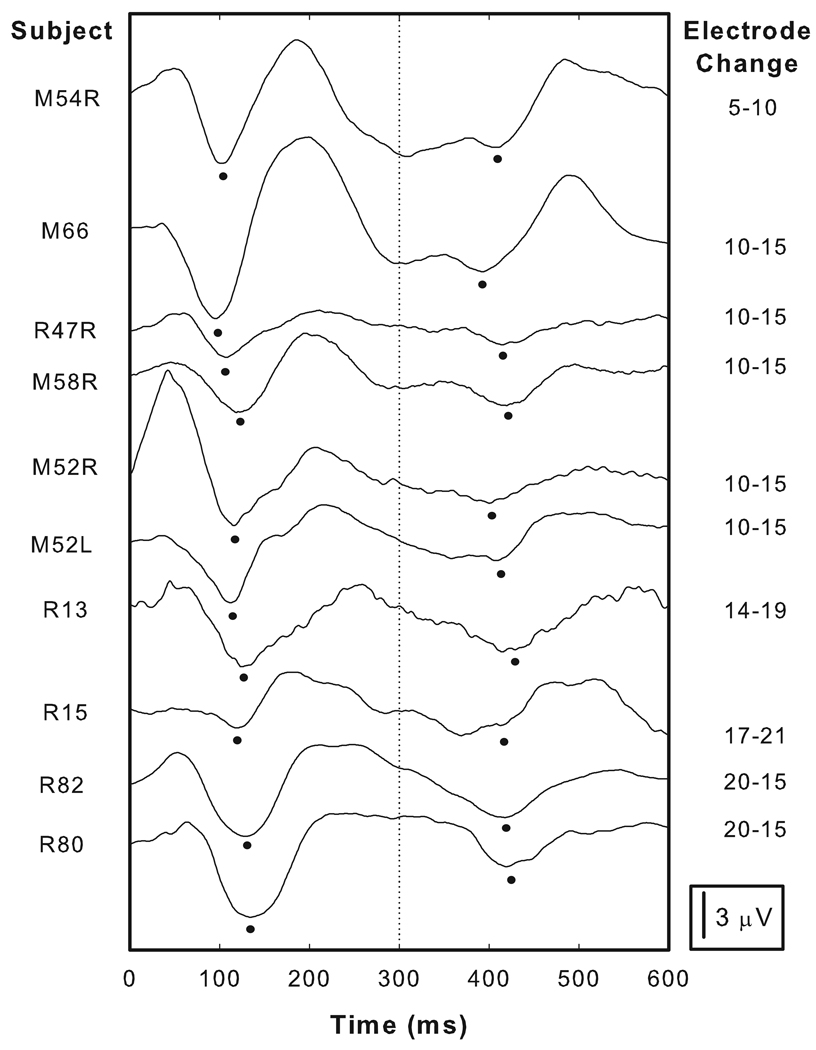
Figure 3.
The waveforms shown in the lower panel of Figure 2 have been have been shifted along the ordinate and re-plotted. The column on the right indicates the stimulating electrodes used to elicit these responses. For each subject, an onset response as well as an EACC is recorded and the dots indicate the N1 peaks picked for both the onset responses and for the EACC. More details about the stimulation parameters are listed in Table 2.

