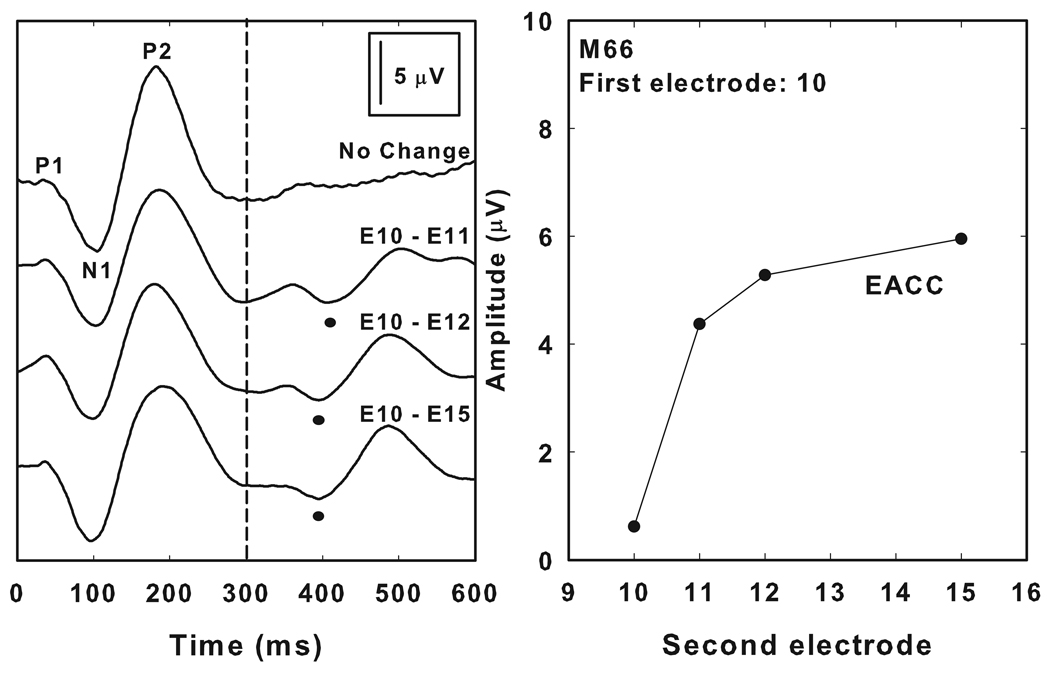
Figure 4.
The left panel shows a series of onset and EACC responses recorded from an individual study participant (M66). In each case, stimulation began on electrode 10. The upper waveform is a control/no change condition. As indicated on the figure, the stimulating electrode was changed 300 ms after stimulation was begun to a second electrode located apical to electrode 10. The right panel shows amplitude of these EACC responses as measured between N1 and P2. In this graph, response amplitude is plotted as a function of the second electrode in the stimulus pair. In the control/no change condition, the second electrode stimulated was electrode 10. The separation between the two stimulating electrodes increased as the second electrode was changed from electrode 11 to electrode 15.

