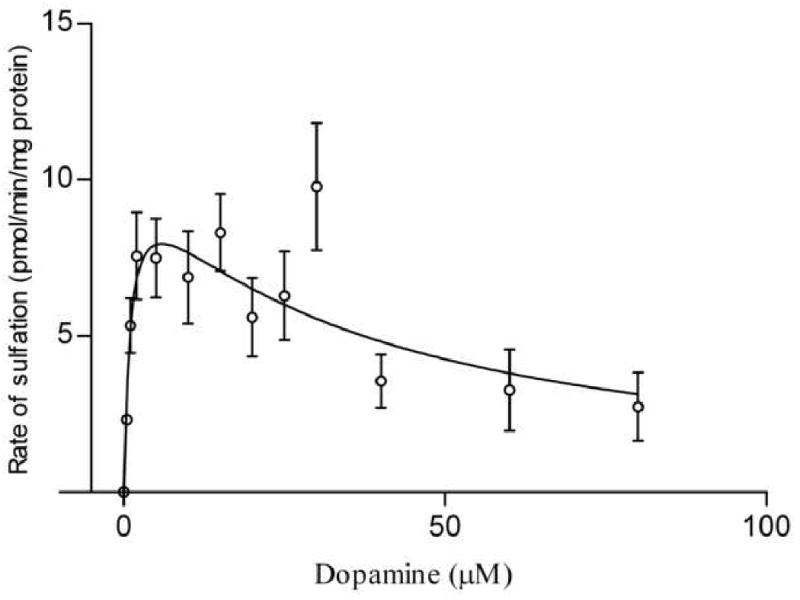
Figure 4. Sulfation of dopamine (pmol/min/mg protein) in BeWo cells as a function of dopamine concentration.

The figure represents a fit to the substrate inhibition equation (section 2.6). Each assay was repeated at least twice and each point represents the mean ± S.E.M. of three or more determinations. Kinetic parameters were as follows: Km = 1.1 ± 0.66 μM, Ki = 32.9 ± 17.5 μM.
