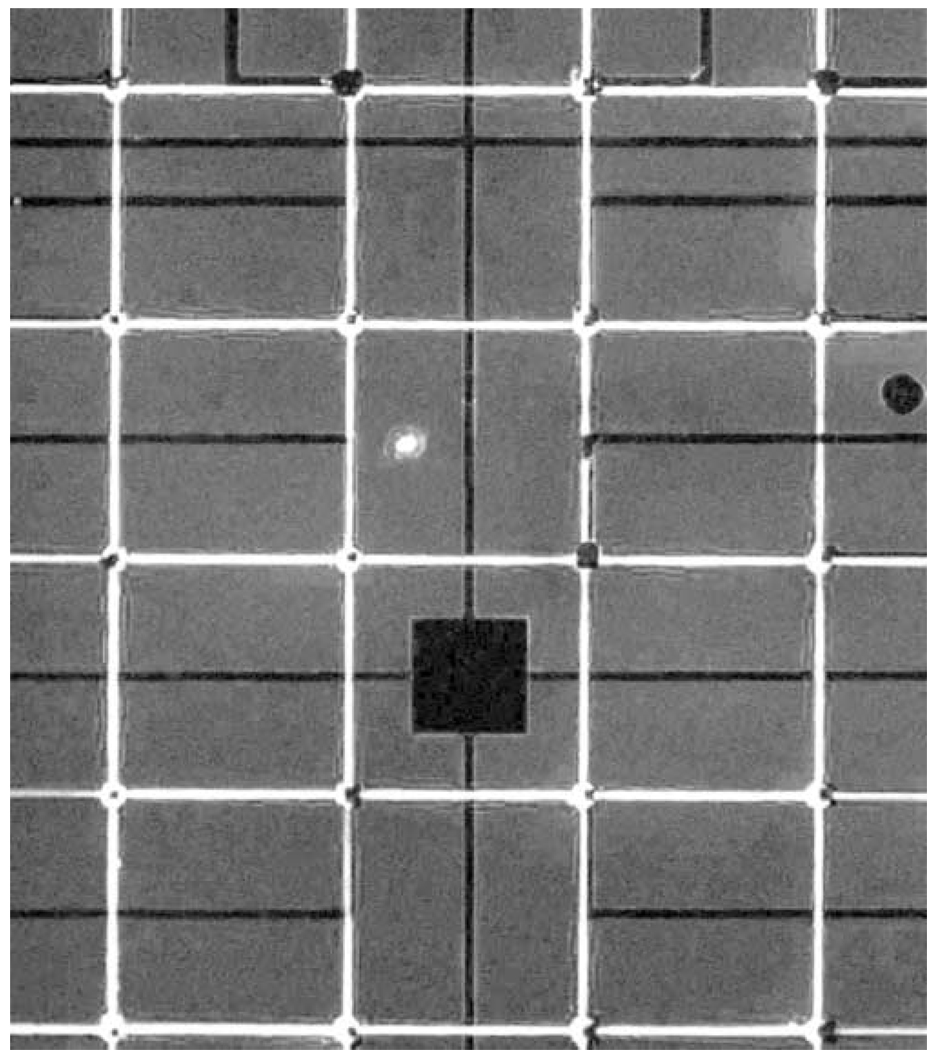
Figure 2. Fluorescence micrograph illustrating aligned stamping of poly-L-lysine to a MEA.
FITC-labeled poly-L-lysine (white grid lines) was included in the stamping solution. Electrode sites are observed as dark squares inside the electrode sites. This maybe due to either quenching of the fluorescence signal due to the platinum black deposited on the electrode sites or lack of protein transfer to these regions because of the non-uniform surface produced by the platinum deposition. The darker profiles in the image represent the leads or the central square ground electrode.

