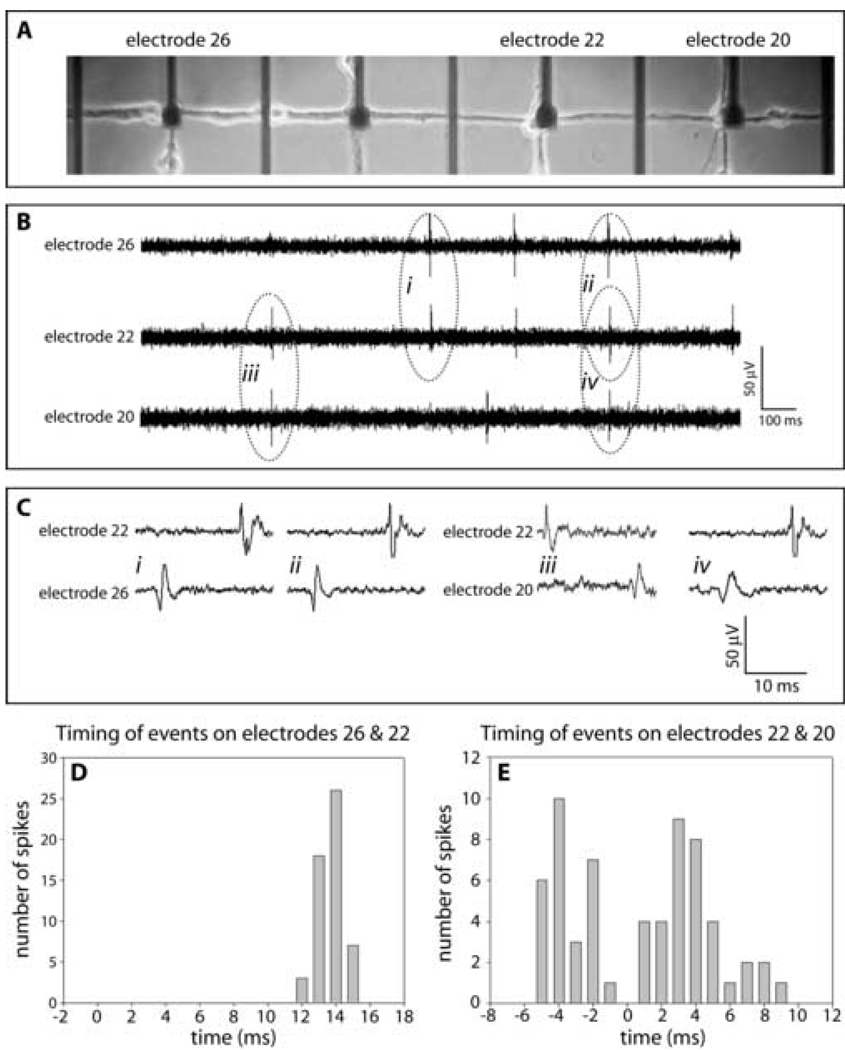
Figure 4. Representative data illustrating propagation of signals between two electrode sites recorded at DIV20.
(A) Phase microscopic image of living culture. (B) Signal recordings on electrodes 26, 22, and 20 demonstrating temporal correlations. (C) Signal recordings indicated in B with more temporal resolution. (D & E) Histograms plotting numbers of observations vs. latencies between events measured at the indicated electrodes.

