
Figure 4.
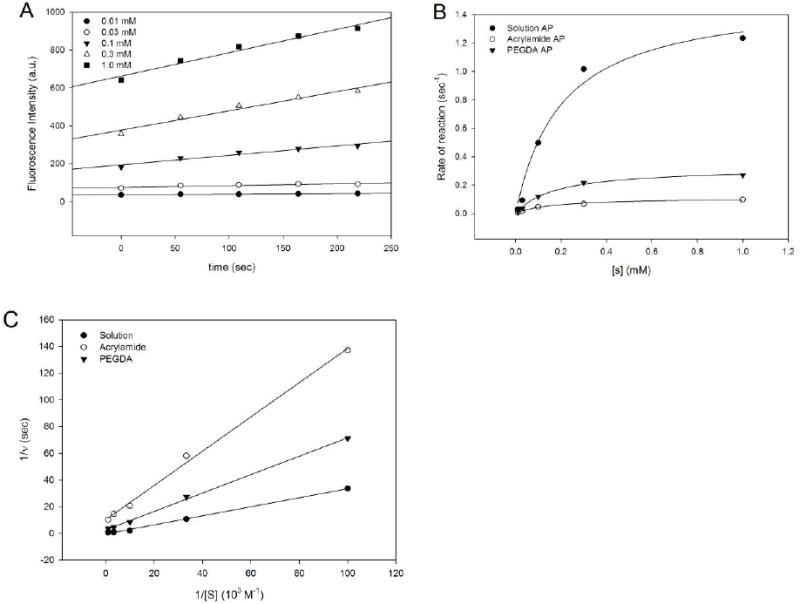
Kinetic analyses of released alkaline phosphatase enzyme activity. (A) Representative graph illustrating ELF-97 product produced using different substance concentrations. These data were obtained using freshly prepared alkaline phosphatase solution. (B) Plots the calculated enzymatic rates from solution, polyacrylamide-released, and PEGDA-released alkaline phosphatase as a function of substrate (ELF-97) concentration. (C) Michaelis-Menton plots of rates (1/v) for the date presented in B. Lines were drawn for linear regression analysis (A and C) and hyperbola nonlinear regression for (B)