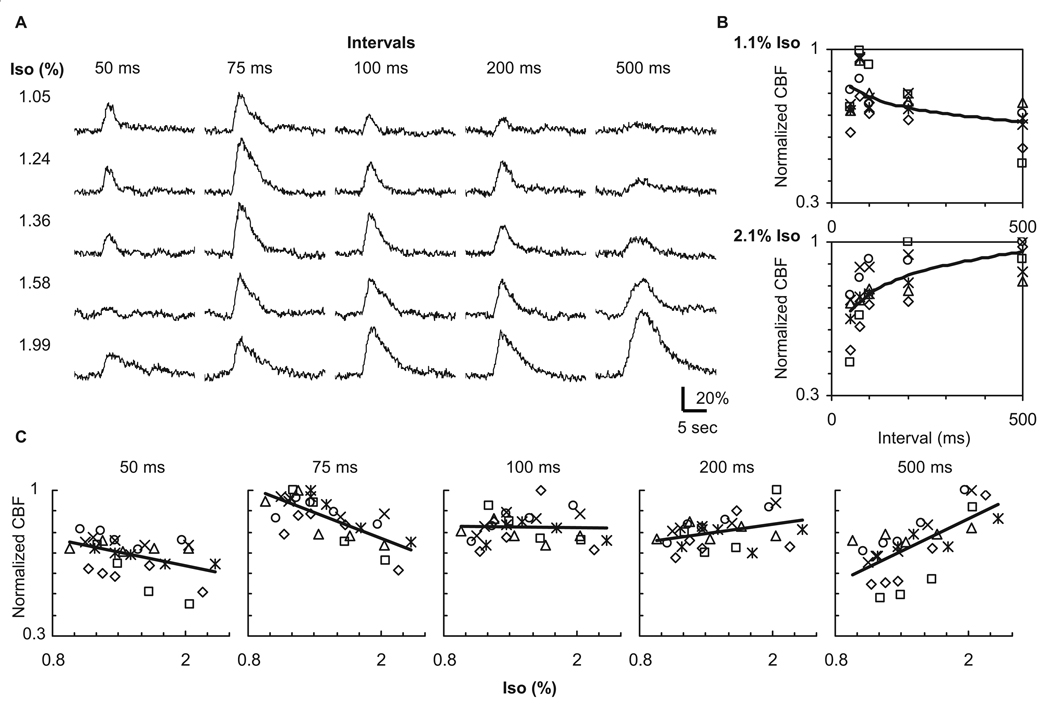
Figure 5. Evoked blood flow response induced by ten-pulse stimuli.
A: CBF data obtained from a representative animal. The intensity of the CBF response decreased for high-frequency stimuli (50 and 75 ms intervals) with increases in the isoflurane level (Iso), whereas the CBF response dose-dependently increased for low-frequency stimuli (200 and 500 ms intervals). Consequently, the effect of the isoflurane dose on the CBF response was opposite between low and high frequency stimuli. B: Population data (N = 6) of the CBF peak plotted against inter-pulse interval under low and high isoflurane conditions. Each symbol represents the data from individual animals normalized by their corresponding peak. The frequency-dependent CBF response also varied as a function of the isoflurane level; higher frequency stimuli (shorter intervals) induced larger CBF changes at low-dose condition (top), whereas lower frequency stimuli (longer intervals) induced larger CBF changes at high-dose condition (bottom). The curve fit was performed in a logarithmic scale. C: Population data (N = 6) of the CBF peak plotted against isoflurane level at the same stimulation frequency. The correlation between CBF peak and isoflurane level varied from negative to positive as a function of the inter-pulse interval.

