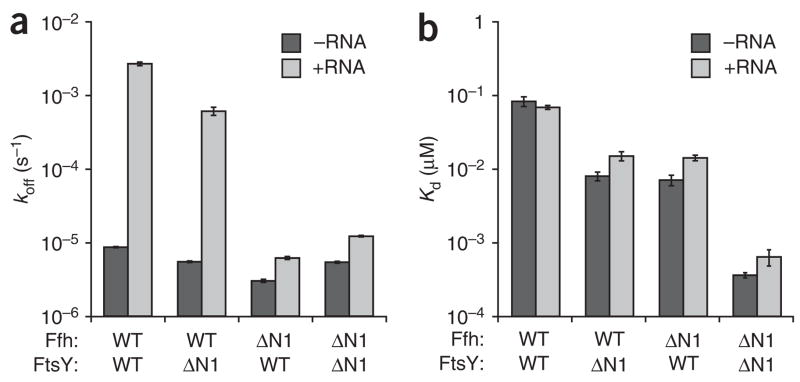
Figure 3.
The N-terminal helices of Ffh and FtsY stimulate Ffh–FtsY complex dissociation in the presence of 4.5S RNA. (a) Bar graphs representing the dissociation rate constants (koff) for disassembly of the Ffh–FtsY complex −RNA (dark gray) and +RNA (light gray). The koffs were measured by forming complexes in the presence of GppNHp and trapping dissociated proteins with GDP. Data were fit to a single-exponential equation, and error bars represent the standard error of the fit. (b) Plot of equilibrium dissociation constants, ± RNA. Kd values were calculated by the equation Kd = koff/kon. Note the log scale axes. WT, wild type.

