Figure 7.
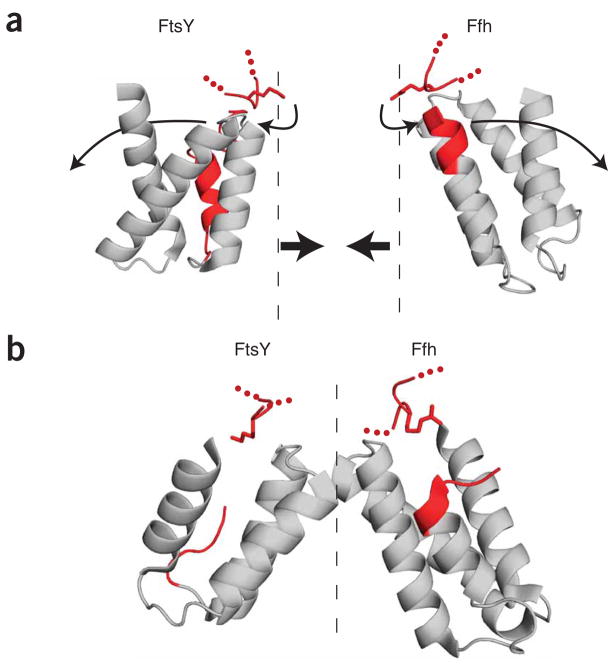
Model for Ffh–FtsY structural rearrangement upon complex formation. (a) Ribbon representations of FtsY and Ffh in unbound form (PDB 2QY9 and PDB 2FFH, respectively). Helix N1 of both proteins is shown in red. Note that, in the unbound form, residue Lys453 of FtsY and residue Arg255 of Ffh (both shown in stick form in red) protrude into the dimerization interface, conceptually represented by a dashed line. (b) Ribbon representation of the Ffh–FtsY complex (PDB 1OKK). In the bound form, Lys453 of FtsY and Arg255 of Ffh move away from the interface, into the space formerly occupied by helix N1.

