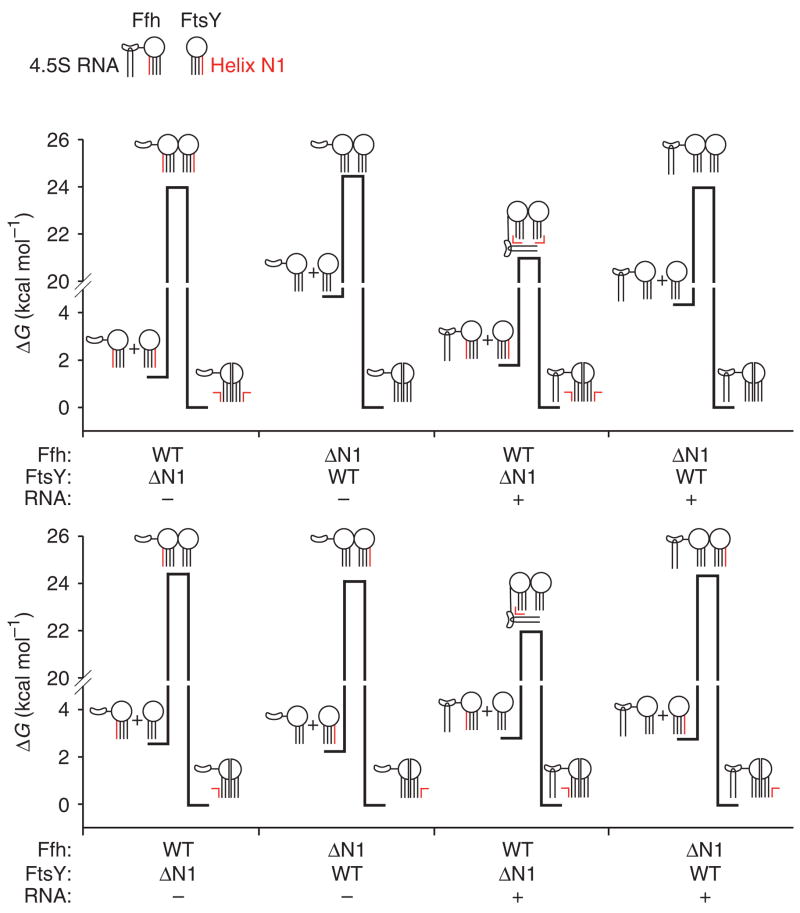
Figure 8.
Thermodynamic model describing the mechanism of SRP RNA control of the interaction of the SRP and SR. Free-energy diagrams for interaction of Ffh and FtsY wild type (WT) and N-terminal truncation variants with and without 4.5S RNA. The free energy of activation is calculated from the observed association and dissociation rate constants (k) using the equation ΔG‡ = −RT ln(hk/kBT), where h is Planck’s constant, kB is the Boltzmann constant, T is the absolute temperature and R is the universal gas constant. For forward reactions, a standard state of 1 μM was used to calculate free-energy changes. Cartoons depict Ffh and FtsY with circles representing the GTPase domain and lines representing the N-terminal four-helix bundle. The N1 helices are shown in red. Ffh additionally is shown with the M domain and the 4.5S RNA (hairpin). 4.5S RNA is shown interacting with helix N1 of Ffh and FtsY in the transition-state complex in a manner that is dependent on helix N1 of Ffh.

