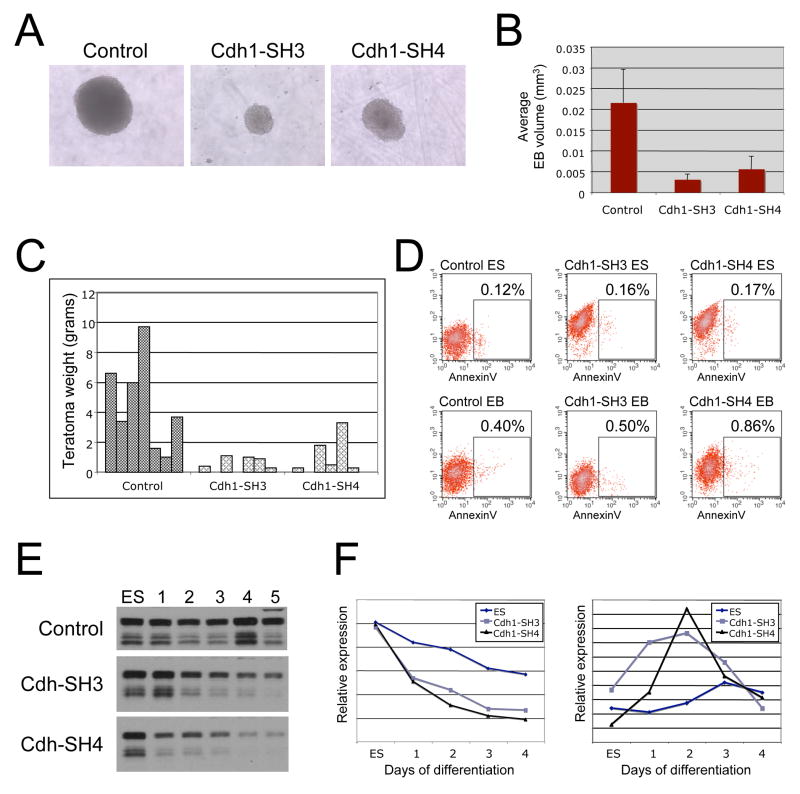
Figure 6. Loss of E-Cadherin expression compromises EB- and teratoma formation by accelerating ES cell differentiation.
A: Representative images demonstrating EB differentiation of wild type and E-Cadherin knockdown ES cells. Loss of Cadherin expression results in small EB size compared to the wild-type EBs. B: Bar-graph analysis of the size of Wild-type or E-Cadherin knockdown EBs C: The effect of loss of E-Cadherin expression on teratoma formation. Plotted is the weight (in grams) of seven teratomas of wild-type and seven each of two independent E-Cadherin knockdown ES cell lines. Loss of E-Cadherin results in a profound reduction in teratoma size. D: Analysis of apoptotic frequency in control and E-Cadherin knockdown cells. Stable ES cell lines transduced with control vector or two independent E-Cadherin knockdown hairpins were analyzed by flow cytometry for AnnexinV staining. The ES cells expressed a tdTomato fluorescent reporter gene to distinguish them from the MEF feeder cells. Top panels: AnnexinV-FITC staining of control and two E-Cadherin knockdown ES cell lines. The percentage of AnnexinV-positive cells in indicated. Bottom panels: AnnexinV staining of the same cell lines after 7 days of monolayer differentiation of the cells. E: E-Cadherin downregulation results in early loss of Nanog expression and premature upregulation of HoxB1. Western-blot analysis of Nanog protein expression during differentiation of control ES cells (top) and two independent E-Cadherin knockdown ES cell lines (middle and lower panels). Numbers indicate days of differentiation. F: Left: Q-PCR analysis of the Nanog RNA levels in the same samples. Right: Q-PCR analysis of HoxB1 expression in the same samples.

