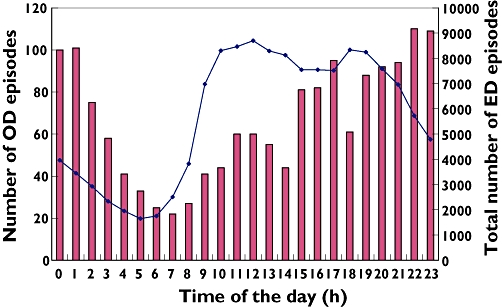
Figure 3.

The timing of all overdose presentations during the year of the study (bars plotted against the left-hand y axis) compared with all ED presentations in the year (line plotted against the right-hand y axis) over the 24 h period. OD episodes ( ); All ED episodes (
 )
)
