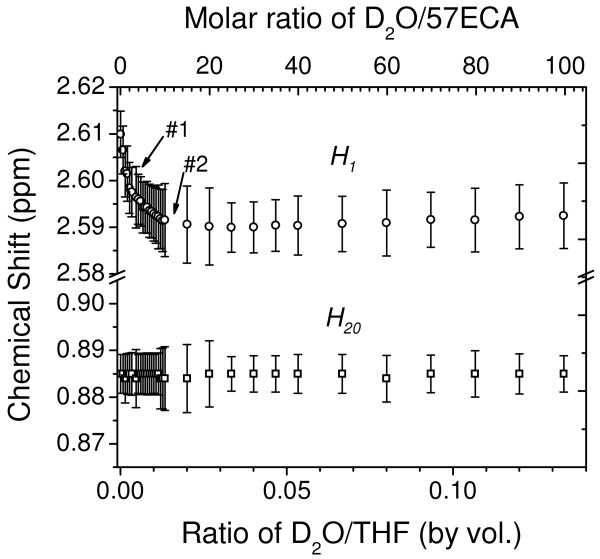
Figure 5.
Chemical shift and line width variation of H1 and H20 peaks, as a function of increasing D2O concentration in THF-d8. Open circles and squares denote the chemical shifts of peaks, respectively. Error bars depict the corresponding full-width at half-maximum (FWHM) values of the H1 and H20 peaks.

