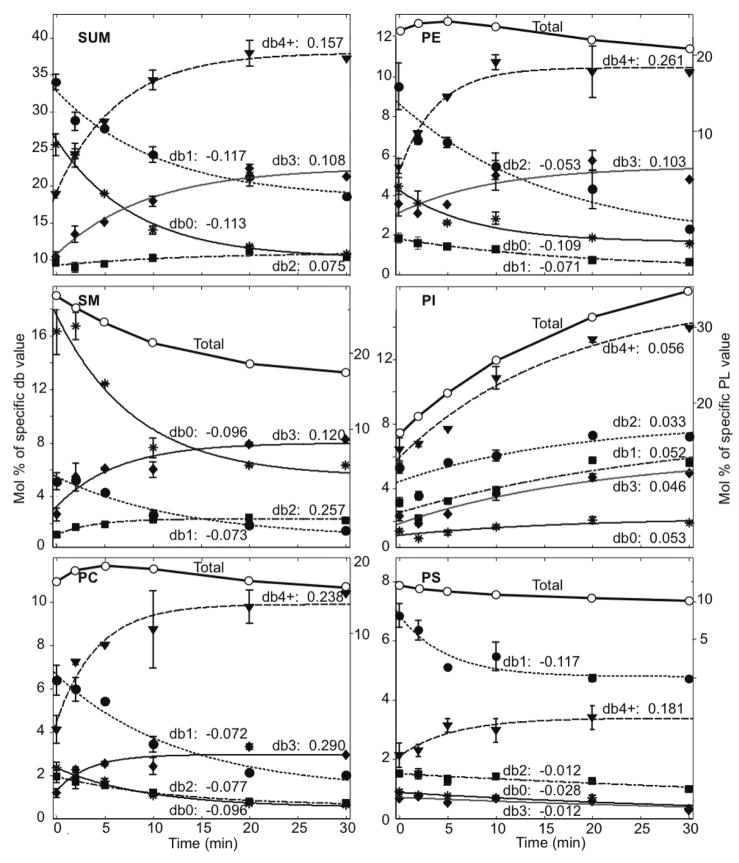
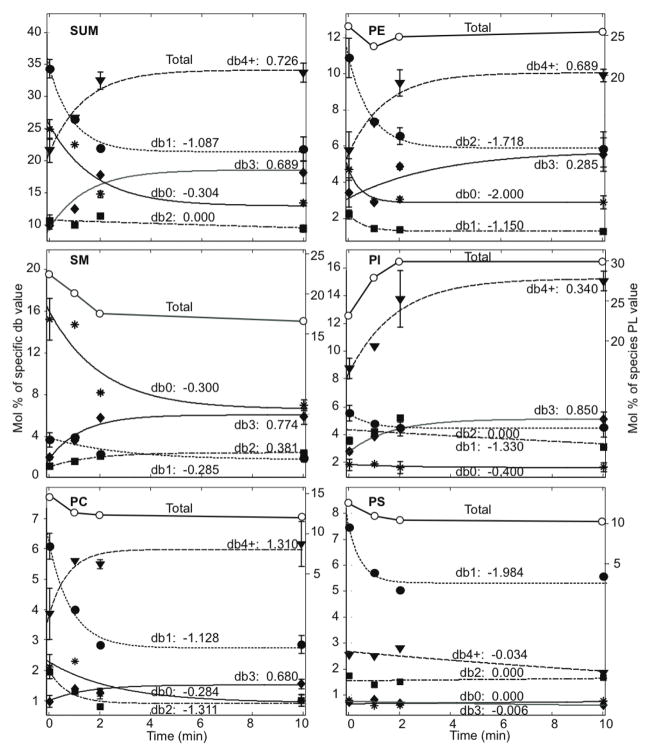
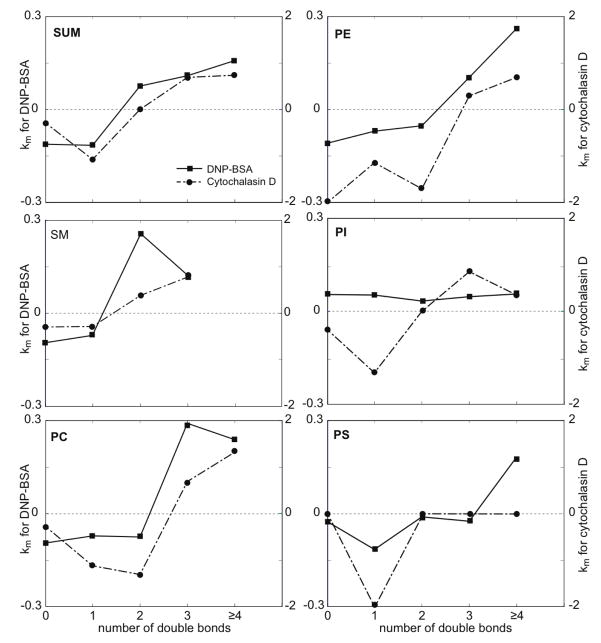
FIGURE 1.
Mol % of phospholipids (PL) in DRMs that contain 0, 1, 2, 3, and ≥ 4 double bonds (db0, db1, db2, db3, db4+, respectively) in the acyl chains versus (A) DNP-BSA antigen stimulation time (average of eight independent experiments) or (B) cytochalasin D stimulation time (average of four independent experiments) for each head group summed over head groups. Data points corresponding to specified number of double bonds (each of db0, db1, db2, db3, db4+) are fitted with an exponential decay corresponding to first-order kinetics (Eqn 1). Values of km = nk (units of min−1) are listed with each fitted curve. Errors bars show standard deviations from ≥ 4 separate experiments (0 and 10 min), or range of values from two separate experiments (2, 5, and 20 min). Data points with no error bars represent a single experiment (1 and 30 min). (C) The km values (units of min−1) from Figures 1A and 1B versus the number of double bonds for each head group for DNP-BSA stimulation (squares, left ordinate) compared with cytochalasin D treatment (circles, right ordinate).


