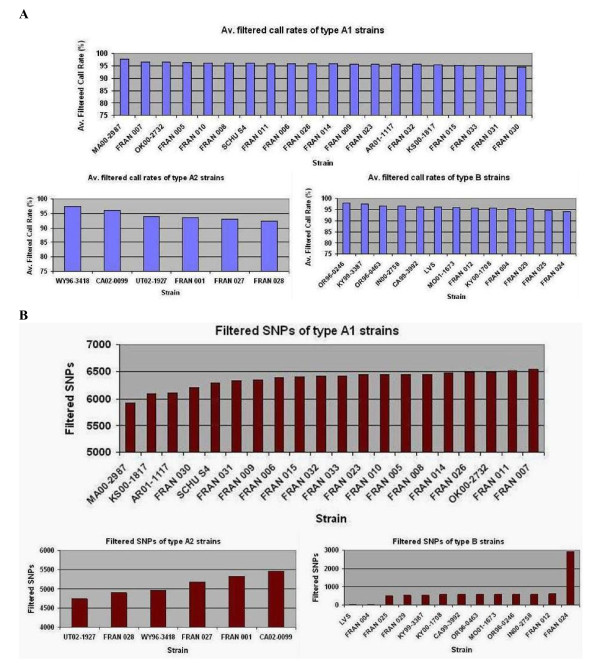
Figure 1.
Whole genome resequencing and SNP profiles of F. tularensis strains. (A) Whole genome resequencing call rates and (B) single nucleotide polymorphic profiles of 39 F. tularensis type A and B strains. The data is an average of sample analysis performed in duplicate. The filtered base call rate and the filtered SNP values were obtained by processing the raw data from Affymetrix software through our bioinformatic filters [13]. Strains are displayed as either A1, A2 or type B for comparative analysis. F. tularensis subsp. novicida (FRAN003) displayed an average filtered base call rate of 83.041% and 12407 filtered SNPs (data not shown).

