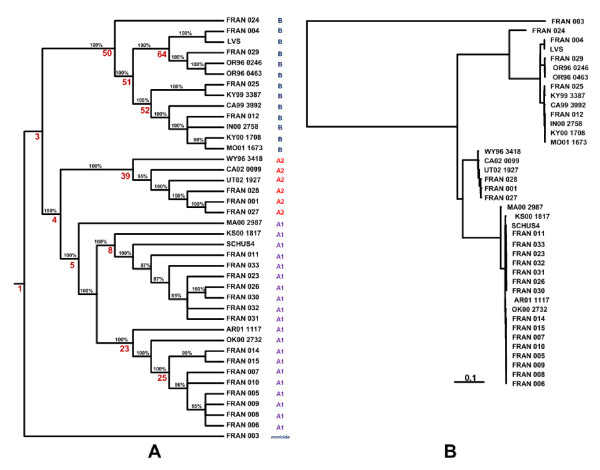
Figure 2.
Whole genome SNP based phylogenetic analysis of Francisella strains. Phylogenetic analysis of resequenced Francisella strains. The whole-genome resequencing data was pared down to those base positions at which a SNP call occurred in one or more of the forty strains. These sequences were used to generate a phylogenetic tree using the MrBayes program as described in methods. This tree was then displayed as a cladogram (A) and as a phylogram (B) using the TreeView program http://taxonomy.zoology.gla.ac.uk/rod/treeview.html. Distinct clustering of type A and type B strains was observed. Both type A and B strains were further discriminated within the clusters. In the cladogram, the percentage values on the branches are the probabilities of the partitions indicated by each branch. The numbers shown in red are node numbers of significant nodes that are referenced in the manuscript. In the phylogram, the branch lengths are proportional to the mean of the posterior probability density, and a scale bar is given to relate the branch lengths to their numeric values.

