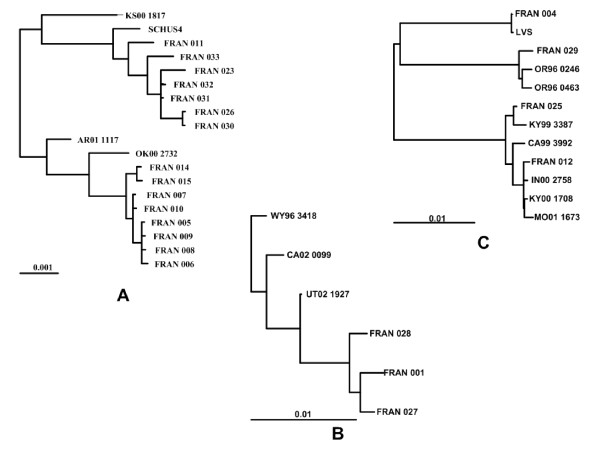
Figure 3.
Expanded phylogram for F. tularensis A1, A2 and type B strains. Expanded sections of the phylogram (Figure 2B) containing the F. tularensis A1 strains except MA00 2987 (A), A2 strains (B) and type B strains except FRAN024 (C). The three subtrees are shown at different scales. The scale bars below each subtree are given to relate the branch lengths to their numeric probability values.

