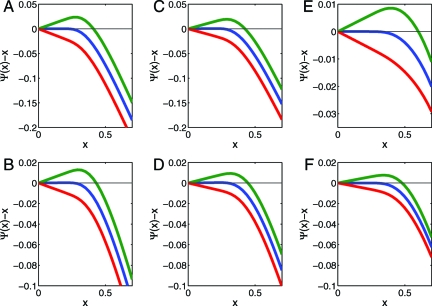
Fig. 2.
Development of fixed points for formal MSE evolution. Here we plot Ψ(σ2) − σ2, where Ψ(·) is the MSE map for χ = + (left column), χ = ± (center column), and χ = □ (right column) and where δ = 0.1 (upper row, χ ∈{+,±}), δ = 0.55 (upper row, χ = □), δ = 0.4 (lower row, χ ∈{+,±}), and δ = 0.75 (lower row, χ = □). A crossing of the y axis corresponds to a fixed point of Ψ. If the graphed quantity is negative for positive σ2, Ψ has no fixed points for σ > 0. Different curves correspond to different values of ρ: where ρ is respectively less than, equal to, and greater than ρSE. In each case, Ψ has a stable fixed point at zero for ρ <ρSE and no other fixed points, an unstable fixed point at zero for ρ = ρSE, and develops two fixed points at ρ > ρSE. Blue curves correspond to ρ = ρSE(δ;χ), green corresponds to ρ = 1.05 ·ρSE(δ;χ), and red corresponds to ρ = 0.95 ·ρSE(δ;χ).

