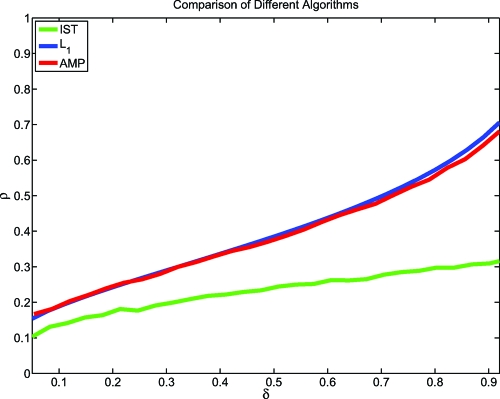
Fig. 3.
Observed phase transitions of reconstruction algorithms. Red curve, AMP; green curve, iterative soft thresholding (IST); blue curve, theoretical ℓ1 transition. Parameters of IST tuned for best possible phase transition (3). Reconstruction signal length N = 1,000. T = 1,000 iterations. Empirical phase transition is value of ρ at which success rate is 50%. Details are in SI Appendix.

