
Fig. 4.
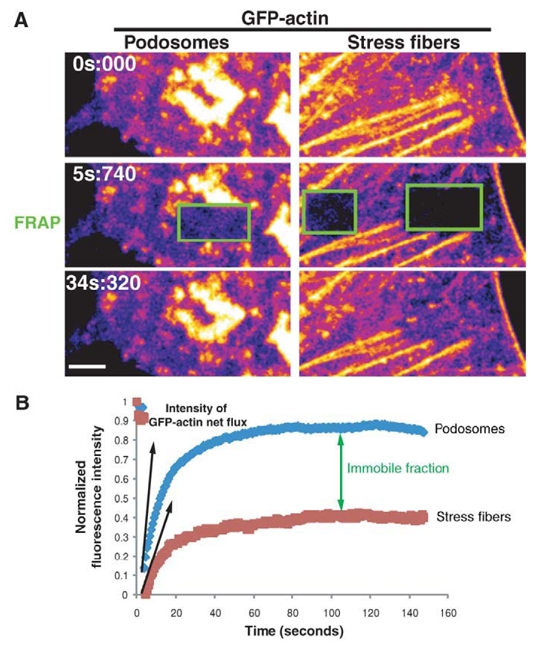
Actin dynamics in stress fibers and invadopodia rosettes in mouse embryonic fibroblasts transformed with Src. (A) Recovery of GFP-actin after photobleaching (green rectangles) is faster in invadopodial rosettes than in stress fibers. Images were extracted from a time series in which mouse embryonic fibroblasts expressing Src and GFP-actin were shown to form both invadopodial rosettes and stress fibers. Imaging and photobleaching conditions were exactly the same in both conditions. (B) Analysis of normalized fluorescence intensity shows that the net flux of actin, which is determined by the tangent at the origin of the recovery curve (black arrows), is faster in podosomes than in stress fibers. The plateau of the recovery curve does not reach the same level as before photobleaching, allowing the determination of the immobile fraction in each structure. From this analysis, it seems that stress fibers are composed mostly of poorly dynamic F-actin.