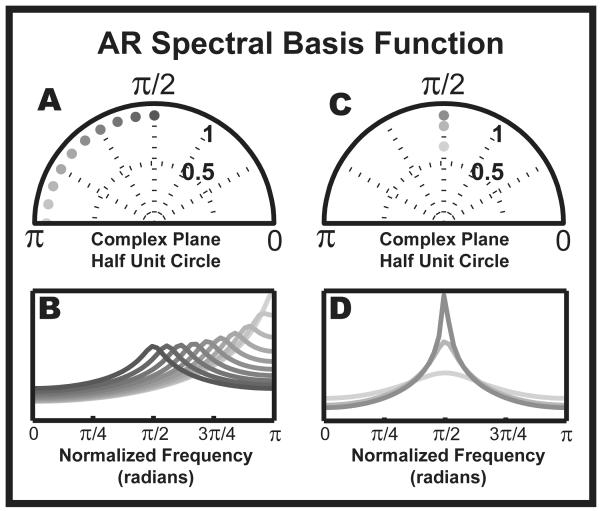
Figure 1.
Parametric spectral basis functions. The AR poles completely specify the basis function for the AR PSD. The parameters which define the basis are pole phase and pole magnitude. This figure explores the parameter space and visualizes the range of the AR spectral basis function. (A) and (B): Altering the pole phase results in a systematic shift in the location of the peak. (C) and (D): Altering the pole magnitude alters the spread of the basis function. The differences in peak basis power in (B) and (D) can be viewed as distributions for observed-frequency variance. When the basis peak is sharp, the variance in the frequency of oscillation is small, like that of a narrow-band oscillation. Otherwise, the AR model indicates that the data is a noisy oscillator that possibly contains wide-band background activity. The value of radians is equivalent to half the sampling frequency of the data.

