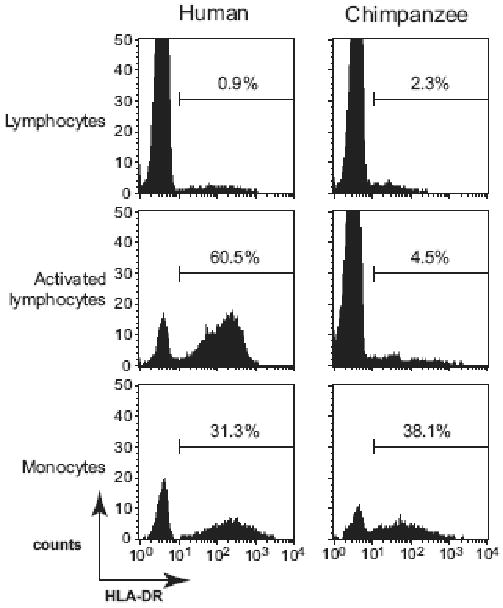
Figure 5. Surface expression of HLA-DR on CD4+ lymphocytes and monocytes.

CD4-positively selected cells (lymphocytes and monocytes) and activated CD4+ lymphocytes were stained with anti-HLA-DR-FITC, anti-CD4-PECy5 and anti-CD3-PE antibodies. A representative profile for one human (left panels) and one chimpanzee (right panels) donor is shown (x-axis = log FITC fluorescence, y-axis = cell counts). Electronic gates were set for lymphocyte (CD4+ CD3+ population) or monocyte (CD4+ CD3-) populations and HLA-DR expression was analyzed. The percentage of cells expressing HLA-DR is indicated for each cell type.
